Immigrants from South Central Asia vs Zimbabwean Median Household Income
COMPARE
Immigrants from South Central Asia
Zimbabwean
Median Household Income
Median Household Income Comparison
Immigrants from South Central Asia
Zimbabweans
$106,057
MEDIAN HOUSEHOLD INCOME
100.0/ 100
METRIC RATING
10th/ 347
METRIC RANK
$90,618
MEDIAN HOUSEHOLD INCOME
97.2/ 100
METRIC RATING
108th/ 347
METRIC RANK
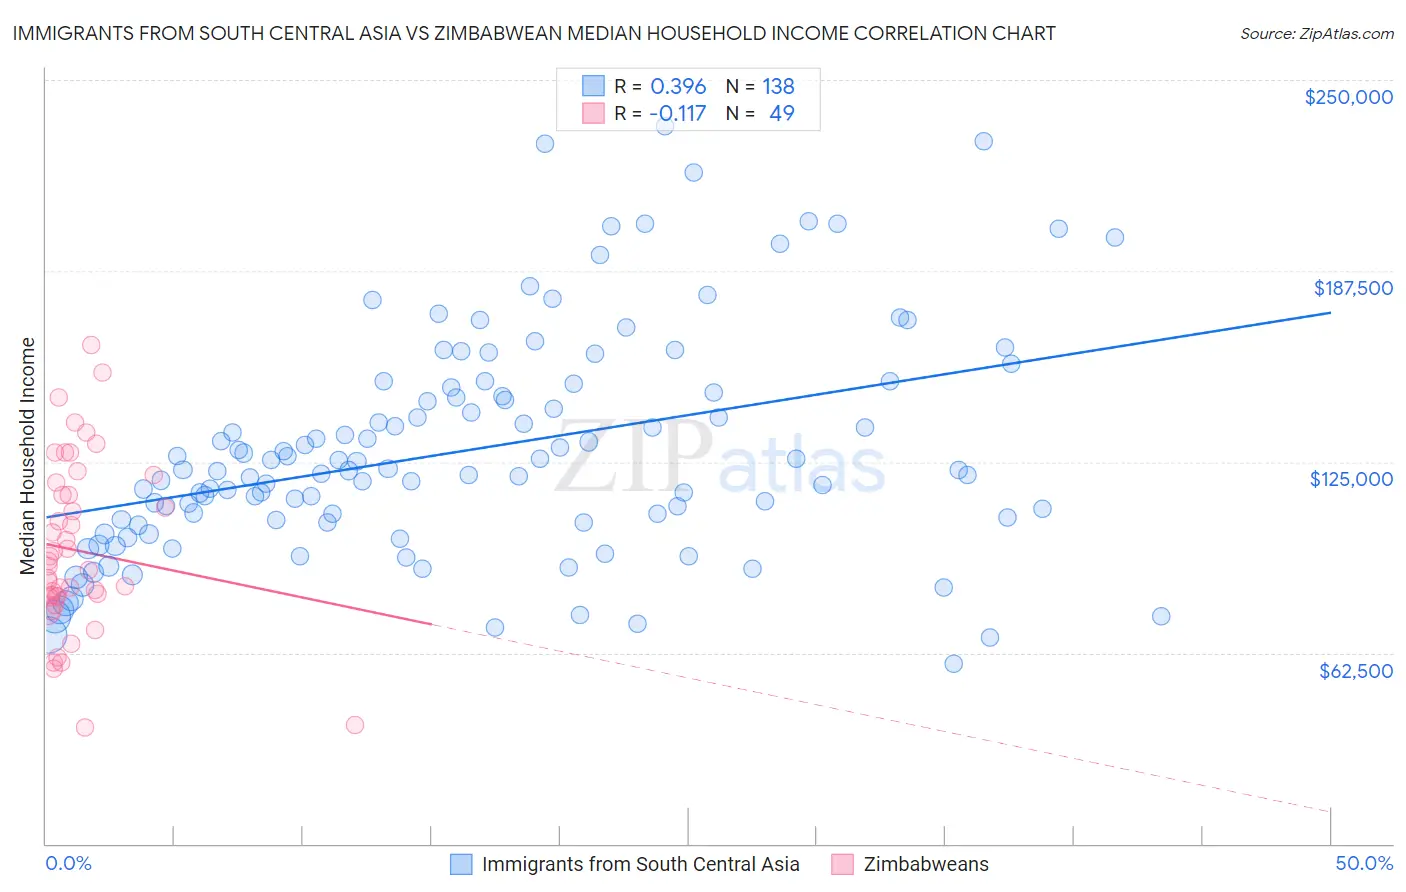
Immigrants from South Central Asia vs Zimbabwean Median Household Income Correlation Chart
The statistical analysis conducted on geographies consisting of 472,541,565 people shows a mild positive correlation between the proportion of Immigrants from South Central Asia and median household income in the United States with a correlation coefficient (R) of 0.396 and weighted average of $106,057. Similarly, the statistical analysis conducted on geographies consisting of 69,185,411 people shows a poor negative correlation between the proportion of Zimbabweans and median household income in the United States with a correlation coefficient (R) of -0.117 and weighted average of $90,618, a difference of 17.0%.
Median Household Income Correlation Summary
| Measurement | Immigrants from South Central Asia | Zimbabwean |
| Minimum | $58,750 | $38,056 |
| Maximum | $234,750 | $163,274 |
| Range | $176,000 | $125,218 |
| Mean | $128,797 | $96,050 |
| Median | $122,210 | $90,998 |
| Interquartile 25% (IQ1) | $105,243 | $80,817 |
| Interquartile 75% (IQ3) | $147,699 | $116,275 |
| Interquartile Range (IQR) | $42,456 | $35,458 |
| Standard Deviation (Sample) | $36,764 | $28,116 |
| Standard Deviation (Population) | $36,630 | $27,827 |
Similar Demographics by Median Household Income
Demographics Similar to Immigrants from South Central Asia by Median Household Income
In terms of median household income, the demographic groups most similar to Immigrants from South Central Asia are Okinawan ($106,624, a difference of 0.53%), Immigrants from China ($105,335, a difference of 0.69%), Indian (Asian) ($105,262, a difference of 0.76%), Immigrants from Eastern Asia ($104,796, a difference of 1.2%), and Immigrants from Ireland ($104,692, a difference of 1.3%).
| Demographics | Rating | Rank | Median Household Income |
| Immigrants | India | 100.0 /100 | #3 | Exceptional $113,009 |
| Immigrants | Hong Kong | 100.0 /100 | #4 | Exceptional $111,519 |
| Thais | 100.0 /100 | #5 | Exceptional $110,648 |
| Immigrants | Singapore | 100.0 /100 | #6 | Exceptional $110,428 |
| Iranians | 100.0 /100 | #7 | Exceptional $109,835 |
| Immigrants | Iran | 100.0 /100 | #8 | Exceptional $108,055 |
| Okinawans | 100.0 /100 | #9 | Exceptional $106,624 |
| Immigrants | South Central Asia | 100.0 /100 | #10 | Exceptional $106,057 |
| Immigrants | China | 100.0 /100 | #11 | Exceptional $105,335 |
| Indians (Asian) | 100.0 /100 | #12 | Exceptional $105,262 |
| Immigrants | Eastern Asia | 100.0 /100 | #13 | Exceptional $104,796 |
| Immigrants | Ireland | 100.0 /100 | #14 | Exceptional $104,692 |
| Immigrants | Israel | 100.0 /100 | #15 | Exceptional $104,090 |
| Burmese | 100.0 /100 | #16 | Exceptional $103,145 |
| Immigrants | Korea | 100.0 /100 | #17 | Exceptional $102,962 |
Demographics Similar to Zimbabweans by Median Household Income
In terms of median household income, the demographic groups most similar to Zimbabweans are Chilean ($90,605, a difference of 0.020%), Palestinian ($90,574, a difference of 0.050%), Croatian ($90,685, a difference of 0.070%), Immigrants from Poland ($90,549, a difference of 0.080%), and Macedonian ($90,761, a difference of 0.16%).
| Demographics | Rating | Rank | Median Household Income |
| Immigrants | Moldova | 98.3 /100 | #101 | Exceptional $91,446 |
| Austrians | 98.2 /100 | #102 | Exceptional $91,339 |
| Immigrants | Ukraine | 98.0 /100 | #103 | Exceptional $91,124 |
| Immigrants | Kazakhstan | 97.8 /100 | #104 | Exceptional $91,015 |
| Immigrants | Brazil | 97.7 /100 | #105 | Exceptional $90,907 |
| Macedonians | 97.4 /100 | #106 | Exceptional $90,761 |
| Croatians | 97.3 /100 | #107 | Exceptional $90,685 |
| Zimbabweans | 97.2 /100 | #108 | Exceptional $90,618 |
| Chileans | 97.2 /100 | #109 | Exceptional $90,605 |
| Palestinians | 97.1 /100 | #110 | Exceptional $90,574 |
| Immigrants | Poland | 97.1 /100 | #111 | Exceptional $90,549 |
| Northern Europeans | 96.9 /100 | #112 | Exceptional $90,446 |
| Peruvians | 96.5 /100 | #113 | Exceptional $90,261 |
| Immigrants | Northern Africa | 95.9 /100 | #114 | Exceptional $90,026 |
| Immigrants | Western Asia | 95.9 /100 | #115 | Exceptional $90,005 |