Immigrants from Japan vs Immigrants from Thailand Currently Married
COMPARE
Immigrants from Japan
Immigrants from Thailand
Currently Married
Currently Married Comparison
Immigrants from Japan
Immigrants from Thailand
48.0%
CURRENTLY MARRIED
96.2/ 100
METRIC RATING
86th/ 347
METRIC RANK
45.4%
CURRENTLY MARRIED
5.1/ 100
METRIC RATING
217th/ 347
METRIC RANK
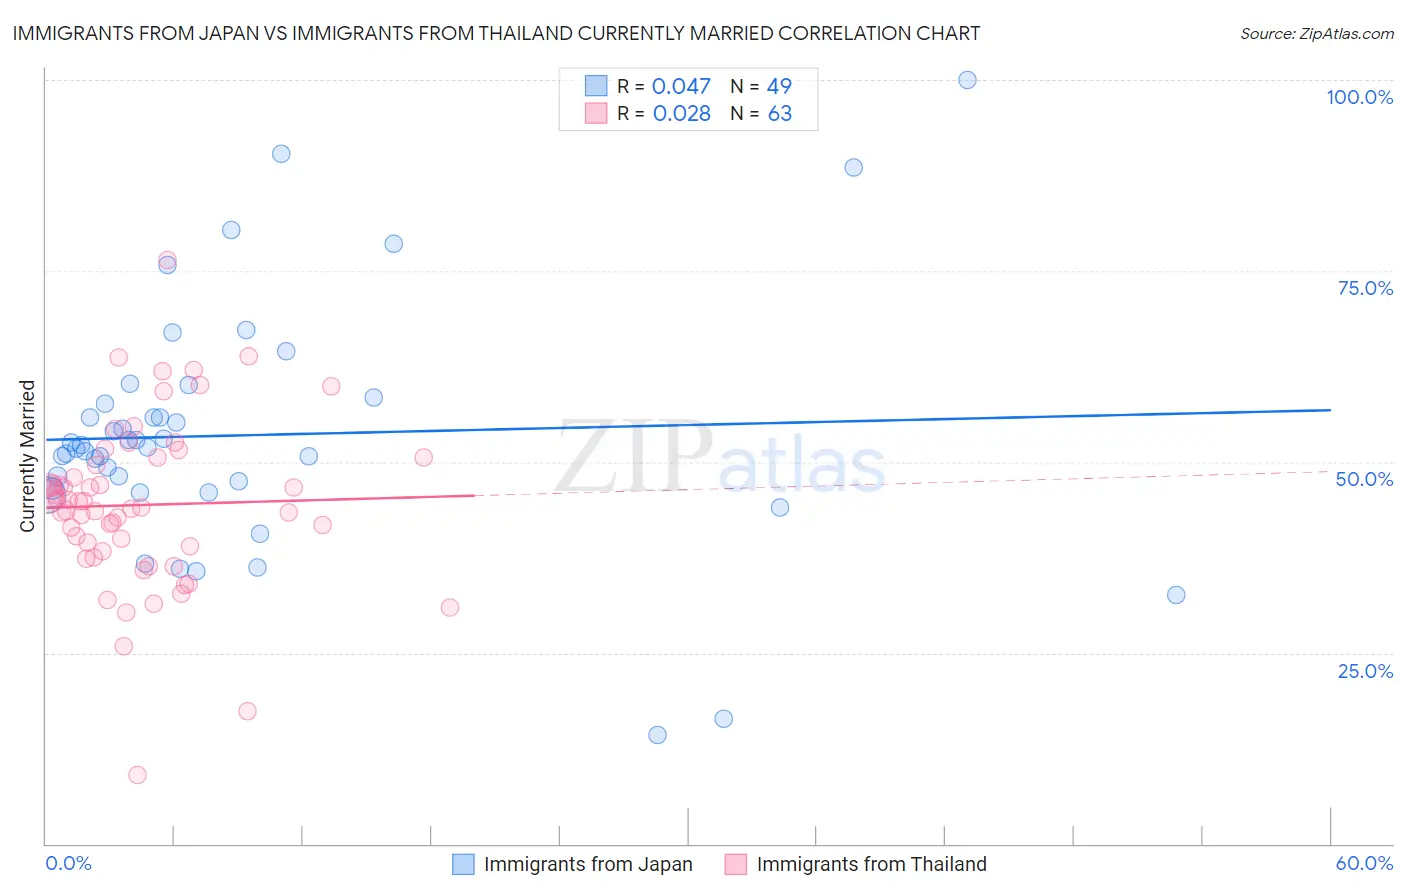
Immigrants from Japan vs Immigrants from Thailand Currently Married Correlation Chart
The statistical analysis conducted on geographies consisting of 340,094,815 people shows no correlation between the proportion of Immigrants from Japan and percentage of population currently married in the United States with a correlation coefficient (R) of 0.047 and weighted average of 48.0%. Similarly, the statistical analysis conducted on geographies consisting of 316,997,410 people shows no correlation between the proportion of Immigrants from Thailand and percentage of population currently married in the United States with a correlation coefficient (R) of 0.028 and weighted average of 45.4%, a difference of 5.8%.
Currently Married Correlation Summary
| Measurement | Immigrants from Japan | Immigrants from Thailand |
| Minimum | 14.3% | 9.0% |
| Maximum | 100.0% | 76.5% |
| Range | 85.7% | 67.5% |
| Mean | 53.5% | 44.4% |
| Median | 51.9% | 44.1% |
| Interquartile 25% (IQ1) | 46.2% | 38.3% |
| Interquartile 75% (IQ3) | 58.1% | 50.6% |
| Interquartile Range (IQR) | 11.8% | 12.3% |
| Standard Deviation (Sample) | 16.1% | 11.0% |
| Standard Deviation (Population) | 15.9% | 11.0% |
Similar Demographics by Currently Married
Demographics Similar to Immigrants from Japan by Currently Married
In terms of currently married, the demographic groups most similar to Immigrants from Japan are Jordanian (48.0%, a difference of 0.010%), French Canadian (48.0%, a difference of 0.030%), Immigrants from Eastern Europe (48.0%, a difference of 0.030%), Indian (Asian) (48.0%, a difference of 0.090%), and American (48.0%, a difference of 0.11%).
| Demographics | Rating | Rank | Currently Married |
| Immigrants | South Africa | 97.0 /100 | #79 | Exceptional 48.1% |
| Immigrants | Poland | 96.9 /100 | #80 | Exceptional 48.1% |
| Immigrants | Sri Lanka | 96.9 /100 | #81 | Exceptional 48.1% |
| Immigrants | Europe | 96.9 /100 | #82 | Exceptional 48.1% |
| Bolivians | 96.9 /100 | #83 | Exceptional 48.1% |
| Immigrants | Israel | 96.9 /100 | #84 | Exceptional 48.1% |
| French Canadians | 96.3 /100 | #85 | Exceptional 48.0% |
| Immigrants | Japan | 96.2 /100 | #86 | Exceptional 48.0% |
| Jordanians | 96.2 /100 | #87 | Exceptional 48.0% |
| Immigrants | Eastern Europe | 96.1 /100 | #88 | Exceptional 48.0% |
| Indians (Asian) | 95.8 /100 | #89 | Exceptional 48.0% |
| Americans | 95.7 /100 | #90 | Exceptional 48.0% |
| Immigrants | Bolivia | 95.6 /100 | #91 | Exceptional 47.9% |
| Koreans | 95.4 /100 | #92 | Exceptional 47.9% |
| Lebanese | 95.1 /100 | #93 | Exceptional 47.9% |
Demographics Similar to Immigrants from Thailand by Currently Married
In terms of currently married, the demographic groups most similar to Immigrants from Thailand are Immigrants from Morocco (45.4%, a difference of 0.080%), Panamanian (45.3%, a difference of 0.24%), Dutch West Indian (45.5%, a difference of 0.28%), German Russian (45.5%, a difference of 0.28%), and Alaska Native (45.5%, a difference of 0.32%).
| Demographics | Rating | Rank | Currently Married |
| Uruguayans | 7.9 /100 | #210 | Tragic 45.6% |
| Houma | 7.2 /100 | #211 | Tragic 45.5% |
| Marshallese | 7.2 /100 | #212 | Tragic 45.5% |
| Alaska Natives | 7.0 /100 | #213 | Tragic 45.5% |
| Dutch West Indians | 6.7 /100 | #214 | Tragic 45.5% |
| German Russians | 6.7 /100 | #215 | Tragic 45.5% |
| Immigrants | Morocco | 5.5 /100 | #216 | Tragic 45.4% |
| Immigrants | Thailand | 5.1 /100 | #217 | Tragic 45.4% |
| Panamanians | 4.0 /100 | #218 | Tragic 45.3% |
| Immigrants | Portugal | 3.5 /100 | #219 | Tragic 45.2% |
| Kenyans | 3.1 /100 | #220 | Tragic 45.2% |
| Mexicans | 3.0 /100 | #221 | Tragic 45.2% |
| Immigrants | Azores | 2.5 /100 | #222 | Tragic 45.1% |
| Immigrants | Laos | 2.3 /100 | #223 | Tragic 45.0% |
| Immigrants | Uganda | 2.2 /100 | #224 | Tragic 45.0% |