Zimbabwean vs Guyanese Average Family Size
COMPARE
Zimbabwean
Guyanese
Average Family Size
Average Family Size Comparison
Zimbabweans
Guyanese
3.20
AVERAGE FAMILY SIZE
12.6/ 100
METRIC RATING
210th/ 347
METRIC RANK
3.40
AVERAGE FAMILY SIZE
100.0/ 100
METRIC RATING
37th/ 347
METRIC RANK
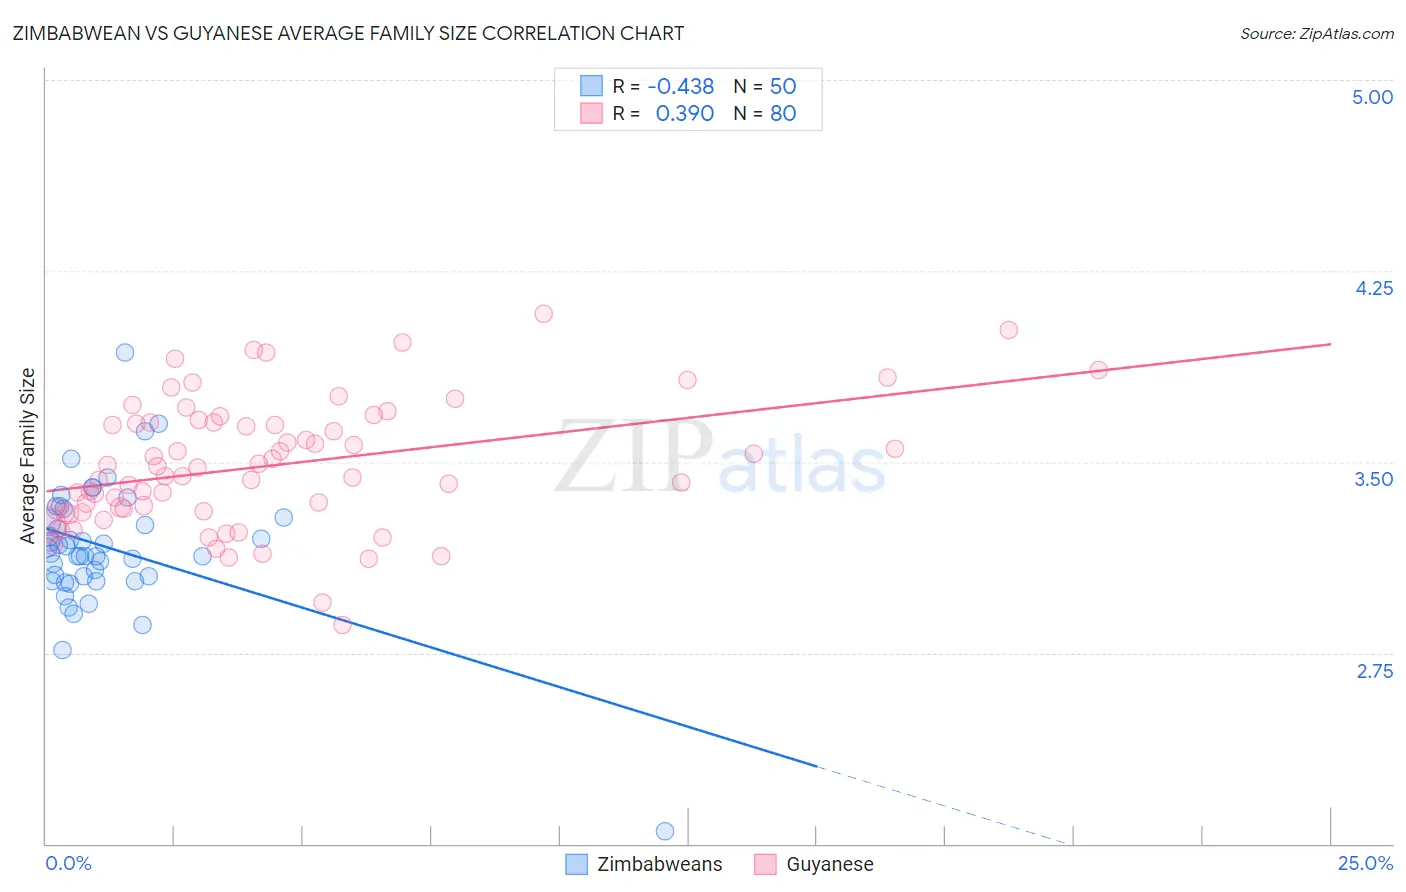
Zimbabwean vs Guyanese Average Family Size Correlation Chart
The statistical analysis conducted on geographies consisting of 69,189,771 people shows a moderate negative correlation between the proportion of Zimbabweans and average family size in the United States with a correlation coefficient (R) of -0.438 and weighted average of 3.20. Similarly, the statistical analysis conducted on geographies consisting of 176,801,738 people shows a mild positive correlation between the proportion of Guyanese and average family size in the United States with a correlation coefficient (R) of 0.390 and weighted average of 3.40, a difference of 6.2%.
Average Family Size Correlation Summary
| Measurement | Zimbabwean | Guyanese |
| Minimum | 2.05 | 2.86 |
| Maximum | 3.93 | 4.08 |
| Range | 1.88 | 1.22 |
| Mean | 3.16 | 3.49 |
| Median | 3.15 | 3.46 |
| Interquartile 25% (IQ1) | 3.05 | 3.31 |
| Interquartile 75% (IQ3) | 3.28 | 3.65 |
| Interquartile Range (IQR) | 0.23 | 0.34 |
| Standard Deviation (Sample) | 0.26 | 0.25 |
| Standard Deviation (Population) | 0.26 | 0.25 |
Similar Demographics by Average Family Size
Demographics Similar to Zimbabweans by Average Family Size
In terms of average family size, the demographic groups most similar to Zimbabweans are Immigrants from Iran (3.20, a difference of 0.020%), Creek (3.20, a difference of 0.020%), Chippewa (3.20, a difference of 0.030%), Sudanese (3.20, a difference of 0.030%), and Filipino (3.20, a difference of 0.040%).
| Demographics | Rating | Rank | Average Family Size |
| Immigrants | Nepal | 18.1 /100 | #203 | Poor 3.21 |
| Immigrants | Poland | 16.6 /100 | #204 | Poor 3.20 |
| Paraguayans | 16.3 /100 | #205 | Poor 3.20 |
| Immigrants | Cabo Verde | 16.0 /100 | #206 | Poor 3.20 |
| Filipinos | 13.6 /100 | #207 | Poor 3.20 |
| Chippewa | 13.3 /100 | #208 | Poor 3.20 |
| Sudanese | 13.3 /100 | #209 | Poor 3.20 |
| Zimbabweans | 12.6 /100 | #210 | Poor 3.20 |
| Immigrants | Iran | 12.1 /100 | #211 | Poor 3.20 |
| Creek | 12.1 /100 | #212 | Poor 3.20 |
| Mongolians | 11.5 /100 | #213 | Poor 3.20 |
| Somalis | 11.2 /100 | #214 | Poor 3.20 |
| Delaware | 11.1 /100 | #215 | Poor 3.20 |
| Bermudans | 11.0 /100 | #216 | Poor 3.20 |
| Immigrants | Somalia | 10.3 /100 | #217 | Poor 3.20 |
Demographics Similar to Guyanese by Average Family Size
In terms of average family size, the demographic groups most similar to Guyanese are Immigrants from Guyana (3.40, a difference of 0.14%), Immigrants from Belize (3.39, a difference of 0.16%), Guatemalan (3.40, a difference of 0.19%), Immigrants from Haiti (3.39, a difference of 0.24%), and Hispanic or Latino (3.41, a difference of 0.25%).
| Demographics | Rating | Rank | Average Family Size |
| Samoans | 100.0 /100 | #30 | Exceptional 3.42 |
| Central Americans | 100.0 /100 | #31 | Exceptional 3.41 |
| Immigrants | Guatemala | 100.0 /100 | #32 | Exceptional 3.41 |
| Hawaiians | 100.0 /100 | #33 | Exceptional 3.41 |
| Hispanics or Latinos | 100.0 /100 | #34 | Exceptional 3.41 |
| Guatemalans | 100.0 /100 | #35 | Exceptional 3.40 |
| Immigrants | Guyana | 100.0 /100 | #36 | Exceptional 3.40 |
| Guyanese | 100.0 /100 | #37 | Exceptional 3.40 |
| Immigrants | Belize | 100.0 /100 | #38 | Exceptional 3.39 |
| Immigrants | Haiti | 100.0 /100 | #39 | Exceptional 3.39 |
| Belizeans | 100.0 /100 | #40 | Exceptional 3.39 |
| Marshallese | 100.0 /100 | #41 | Exceptional 3.38 |
| Immigrants | Vietnam | 100.0 /100 | #42 | Exceptional 3.38 |
| Immigrants | Philippines | 100.0 /100 | #43 | Exceptional 3.37 |
| Alaska Natives | 100.0 /100 | #44 | Exceptional 3.37 |