Central American vs Marshallese Average Family Size
COMPARE
Central American
Marshallese
Average Family Size
Average Family Size Comparison
Central Americans
Marshallese
3.41
AVERAGE FAMILY SIZE
100.0/ 100
METRIC RATING
31st/ 347
METRIC RANK
3.38
AVERAGE FAMILY SIZE
100.0/ 100
METRIC RATING
41st/ 347
METRIC RANK
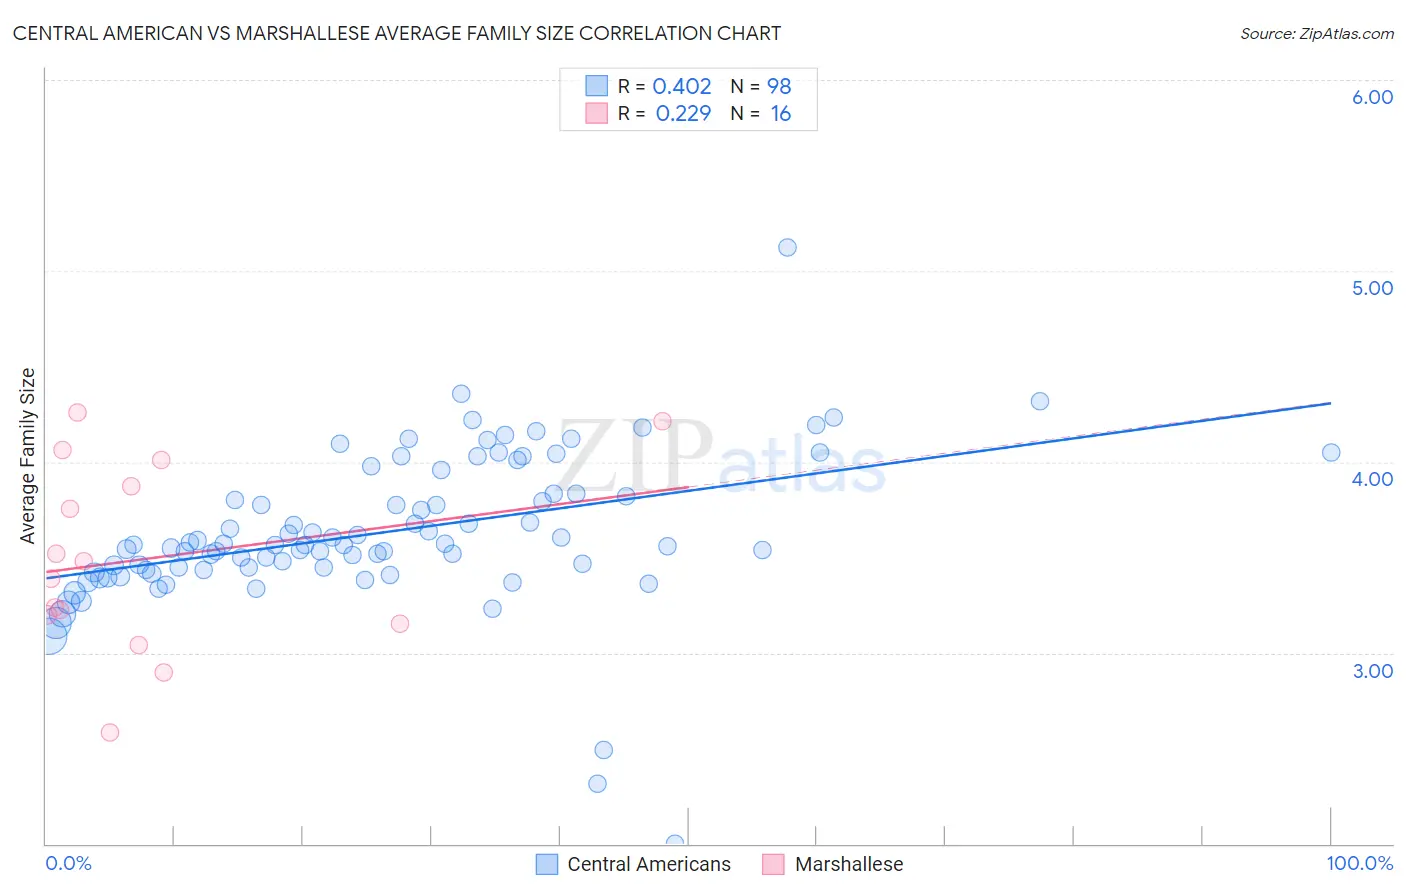
Central American vs Marshallese Average Family Size Correlation Chart
The statistical analysis conducted on geographies consisting of 504,084,527 people shows a moderate positive correlation between the proportion of Central Americans and average family size in the United States with a correlation coefficient (R) of 0.402 and weighted average of 3.41. Similarly, the statistical analysis conducted on geographies consisting of 14,761,315 people shows a weak positive correlation between the proportion of Marshallese and average family size in the United States with a correlation coefficient (R) of 0.229 and weighted average of 3.38, a difference of 0.96%.
Average Family Size Correlation Summary
| Measurement | Central American | Marshallese |
| Minimum | 2.00 | 2.58 |
| Maximum | 5.12 | 4.26 |
| Range | 3.12 | 1.68 |
| Mean | 3.63 | 3.49 |
| Median | 3.56 | 3.43 |
| Interquartile 25% (IQ1) | 3.43 | 3.17 |
| Interquartile 75% (IQ3) | 3.83 | 3.94 |
| Interquartile Range (IQR) | 0.40 | 0.76 |
| Standard Deviation (Sample) | 0.41 | 0.49 |
| Standard Deviation (Population) | 0.40 | 0.48 |
Demographics Similar to Central Americans and Marshallese by Average Family Size
In terms of average family size, the demographic groups most similar to Central Americans are Immigrants from Guatemala (3.41, a difference of 0.10%), Hawaiian (3.41, a difference of 0.12%), Hispanic or Latino (3.41, a difference of 0.18%), Samoan (3.42, a difference of 0.20%), and Nepalese (3.42, a difference of 0.23%). Similarly, the demographic groups most similar to Marshallese are Immigrants from Vietnam (3.38, a difference of 0.060%), Immigrants from Philippines (3.37, a difference of 0.16%), Belizean (3.39, a difference of 0.17%), Alaska Native (3.37, a difference of 0.17%), and Shoshone (3.37, a difference of 0.20%).
| Demographics | Rating | Rank | Average Family Size |
| Native Hawaiians | 100.0 /100 | #26 | Exceptional 3.43 |
| Mexican American Indians | 100.0 /100 | #27 | Exceptional 3.43 |
| Immigrants | Latin America | 100.0 /100 | #28 | Exceptional 3.42 |
| Nepalese | 100.0 /100 | #29 | Exceptional 3.42 |
| Samoans | 100.0 /100 | #30 | Exceptional 3.42 |
| Central Americans | 100.0 /100 | #31 | Exceptional 3.41 |
| Immigrants | Guatemala | 100.0 /100 | #32 | Exceptional 3.41 |
| Hawaiians | 100.0 /100 | #33 | Exceptional 3.41 |
| Hispanics or Latinos | 100.0 /100 | #34 | Exceptional 3.41 |
| Guatemalans | 100.0 /100 | #35 | Exceptional 3.40 |
| Immigrants | Guyana | 100.0 /100 | #36 | Exceptional 3.40 |
| Guyanese | 100.0 /100 | #37 | Exceptional 3.40 |
| Immigrants | Belize | 100.0 /100 | #38 | Exceptional 3.39 |
| Immigrants | Haiti | 100.0 /100 | #39 | Exceptional 3.39 |
| Belizeans | 100.0 /100 | #40 | Exceptional 3.39 |
| Marshallese | 100.0 /100 | #41 | Exceptional 3.38 |
| Immigrants | Vietnam | 100.0 /100 | #42 | Exceptional 3.38 |
| Immigrants | Philippines | 100.0 /100 | #43 | Exceptional 3.37 |
| Alaska Natives | 100.0 /100 | #44 | Exceptional 3.37 |
| Shoshone | 100.0 /100 | #45 | Exceptional 3.37 |
| Haitians | 100.0 /100 | #46 | Exceptional 3.37 |