Yup'ik vs Syrian Average Family Size
COMPARE
Yup'ik
Syrian
Average Family Size
Average Family Size Comparison
Yup'ik
Syrians
4.00
AVERAGE FAMILY SIZE
100/ 100
METRIC RATING
1st/ 347
METRIC RANK
3.19
AVERAGE FAMILY SIZE
6.5/ 100
METRIC RATING
224th/ 347
METRIC RANK
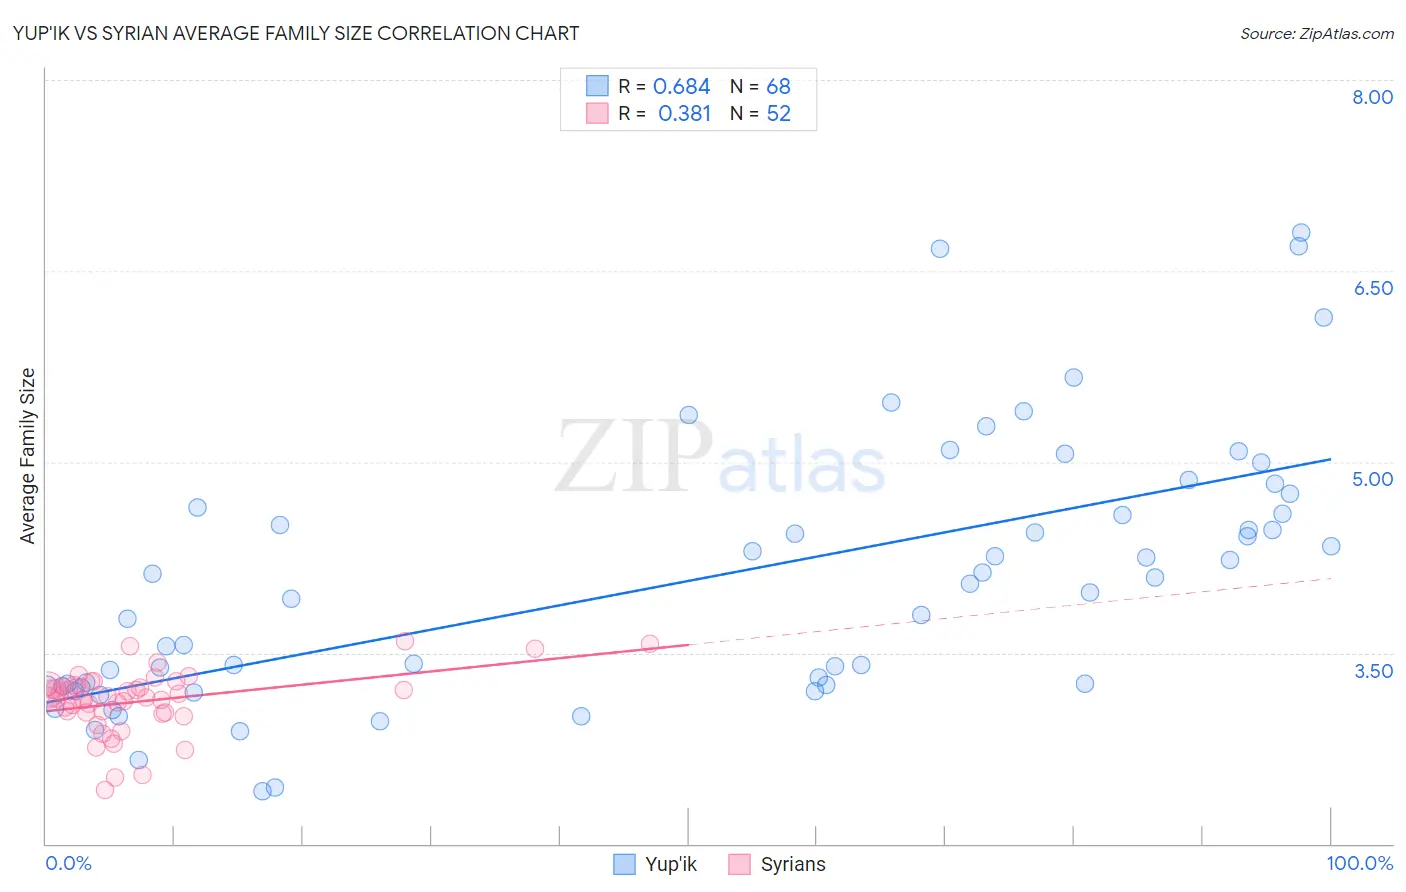
Yup'ik vs Syrian Average Family Size Correlation Chart
The statistical analysis conducted on geographies consisting of 39,956,738 people shows a significant positive correlation between the proportion of Yup'ik and average family size in the United States with a correlation coefficient (R) of 0.684 and weighted average of 4.00. Similarly, the statistical analysis conducted on geographies consisting of 266,181,875 people shows a mild positive correlation between the proportion of Syrians and average family size in the United States with a correlation coefficient (R) of 0.381 and weighted average of 3.19, a difference of 25.3%.
Average Family Size Correlation Summary
| Measurement | Yup'ik | Syrian |
| Minimum | 2.41 | 2.42 |
| Maximum | 6.80 | 3.59 |
| Range | 4.39 | 1.17 |
| Mean | 4.07 | 3.12 |
| Median | 4.01 | 3.15 |
| Interquartile 25% (IQ1) | 3.25 | 3.03 |
| Interquartile 75% (IQ3) | 4.61 | 3.23 |
| Interquartile Range (IQR) | 1.37 | 0.20 |
| Standard Deviation (Sample) | 1.02 | 0.25 |
| Standard Deviation (Population) | 1.01 | 0.24 |
Similar Demographics by Average Family Size
Demographics Similar to Yup'ik by Average Family Size
In terms of average family size, the demographic groups most similar to Yup'ik are Crow (3.82, a difference of 4.5%), Pueblo (3.79, a difference of 5.3%), Pima (3.75, a difference of 6.7%), Navajo (3.65, a difference of 9.6%), and Arapaho (3.64, a difference of 9.9%).
| Demographics | Rating | Rank | Average Family Size |
| Yup'ik | 100 /100 | #1 | Exceptional 4.00 |
| Crow | 100 /100 | #2 | Exceptional 3.82 |
| Pueblo | 100 /100 | #3 | Exceptional 3.79 |
| Pima | 100 /100 | #4 | Exceptional 3.75 |
| Navajo | 100.0 /100 | #5 | Exceptional 3.65 |
| Arapaho | 100.0 /100 | #6 | Exceptional 3.64 |
| Inupiat | 100.0 /100 | #7 | Exceptional 3.63 |
| Immigrants | Yemen | 100.0 /100 | #8 | Exceptional 3.60 |
| Hopi | 100.0 /100 | #9 | Exceptional 3.60 |
| Spanish American Indians | 100.0 /100 | #10 | Exceptional 3.58 |
| Tohono O'odham | 100.0 /100 | #11 | Exceptional 3.53 |
| Immigrants | Mexico | 100.0 /100 | #12 | Exceptional 3.52 |
| Sioux | 100.0 /100 | #13 | Exceptional 3.52 |
| Immigrants | Central America | 100.0 /100 | #14 | Exceptional 3.49 |
| Tongans | 100.0 /100 | #15 | Exceptional 3.49 |
Demographics Similar to Syrians by Average Family Size
In terms of average family size, the demographic groups most similar to Syrians are Cree (3.19, a difference of 0.020%), Immigrants from Zimbabwe (3.19, a difference of 0.040%), Chickasaw (3.19, a difference of 0.040%), Portuguese (3.19, a difference of 0.040%), and Immigrants from Ukraine (3.19, a difference of 0.050%).
| Demographics | Rating | Rank | Average Family Size |
| Immigrants | Somalia | 10.3 /100 | #217 | Poor 3.20 |
| French American Indians | 9.8 /100 | #218 | Tragic 3.20 |
| Pennsylvania Germans | 9.3 /100 | #219 | Tragic 3.19 |
| Lebanese | 9.1 /100 | #220 | Tragic 3.19 |
| Immigrants | Ukraine | 7.2 /100 | #221 | Tragic 3.19 |
| Immigrants | Kuwait | 7.2 /100 | #222 | Tragic 3.19 |
| Immigrants | Zimbabwe | 7.1 /100 | #223 | Tragic 3.19 |
| Syrians | 6.5 /100 | #224 | Tragic 3.19 |
| Cree | 6.2 /100 | #225 | Tragic 3.19 |
| Chickasaw | 6.0 /100 | #226 | Tragic 3.19 |
| Portuguese | 6.0 /100 | #227 | Tragic 3.19 |
| Immigrants | Nonimmigrants | 5.7 /100 | #228 | Tragic 3.19 |
| Immigrants | Italy | 5.3 /100 | #229 | Tragic 3.19 |
| Icelanders | 5.2 /100 | #230 | Tragic 3.19 |
| Basques | 5.2 /100 | #231 | Tragic 3.19 |