Yup'ik vs Apache Single Father Households
COMPARE
Yup'ik
Apache
Single Father Households
Single Father Households Comparison
Yup'ik
Apache
5.4%
SINGLE FATHER HOUSEHOLDS
0.0/ 100
METRIC RATING
347th/ 347
METRIC RANK
2.8%
SINGLE FATHER HOUSEHOLDS
0.0/ 100
METRIC RATING
308th/ 347
METRIC RANK
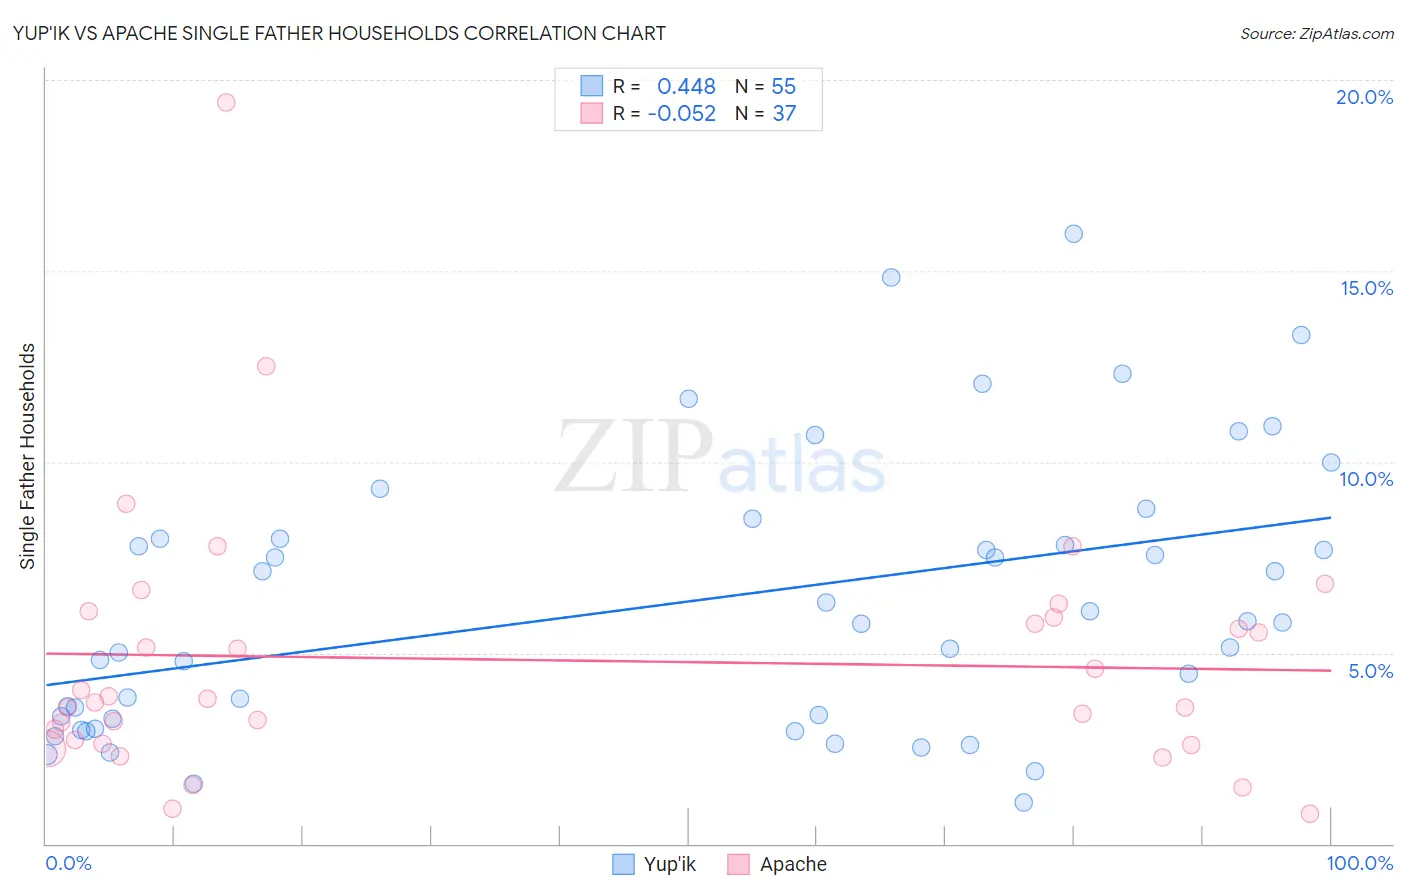
Yup'ik vs Apache Single Father Households Correlation Chart
The statistical analysis conducted on geographies consisting of 39,844,745 people shows a moderate positive correlation between the proportion of Yup'ik and percentage of single father households in the United States with a correlation coefficient (R) of 0.448 and weighted average of 5.4%. Similarly, the statistical analysis conducted on geographies consisting of 230,074,281 people shows a slight negative correlation between the proportion of Apache and percentage of single father households in the United States with a correlation coefficient (R) of -0.052 and weighted average of 2.8%, a difference of 90.0%.
Single Father Households Correlation Summary
| Measurement | Yup'ik | Apache |
| Minimum | 1.1% | 0.80% |
| Maximum | 16.0% | 19.4% |
| Range | 14.9% | 18.6% |
| Mean | 6.3% | 4.8% |
| Median | 5.8% | 3.8% |
| Interquartile 25% (IQ1) | 3.3% | 2.7% |
| Interquartile 75% (IQ3) | 8.0% | 6.0% |
| Interquartile Range (IQR) | 4.7% | 3.3% |
| Standard Deviation (Sample) | 3.6% | 3.4% |
| Standard Deviation (Population) | 3.5% | 3.4% |
Similar Demographics by Single Father Households
Demographics Similar to Yup'ik by Single Father Households
In terms of single father households, the demographic groups most similar to Yup'ik are Inupiat (4.9%, a difference of 10.7%), Menominee (4.2%, a difference of 27.7%), Yakama (4.2%, a difference of 28.6%), Pima (4.2%, a difference of 28.9%), and Tohono O'odham (3.8%, a difference of 40.8%).
| Demographics | Rating | Rank | Single Father Households |
| Natives/Alaskans | 0.0 /100 | #333 | Tragic 3.2% |
| Yuman | 0.0 /100 | #334 | Tragic 3.3% |
| Colville | 0.0 /100 | #335 | Tragic 3.3% |
| Paiute | 0.0 /100 | #336 | Tragic 3.3% |
| Pueblo | 0.0 /100 | #337 | Tragic 3.3% |
| Sioux | 0.0 /100 | #338 | Tragic 3.3% |
| Alaskan Athabascans | 0.0 /100 | #339 | Tragic 3.4% |
| Alaska Natives | 0.0 /100 | #340 | Tragic 3.5% |
| Crow | 0.0 /100 | #341 | Tragic 3.5% |
| Tohono O'odham | 0.0 /100 | #342 | Tragic 3.8% |
| Pima | 0.0 /100 | #343 | Tragic 4.2% |
| Yakama | 0.0 /100 | #344 | Tragic 4.2% |
| Menominee | 0.0 /100 | #345 | Tragic 4.2% |
| Inupiat | 0.0 /100 | #346 | Tragic 4.9% |
| Yup'ik | 0.0 /100 | #347 | Tragic 5.4% |
Demographics Similar to Apache by Single Father Households
In terms of single father households, the demographic groups most similar to Apache are Hopi (2.8%, a difference of 0.18%), Immigrants from the Azores (2.8%, a difference of 0.35%), Hispanic or Latino (2.8%, a difference of 0.50%), Mexican American Indian (2.8%, a difference of 0.66%), and Central American (2.9%, a difference of 0.71%).
| Demographics | Rating | Rank | Single Father Households |
| Immigrants | Latin America | 0.0 /100 | #301 | Tragic 2.8% |
| Spanish Americans | 0.0 /100 | #302 | Tragic 2.8% |
| Immigrants | Honduras | 0.0 /100 | #303 | Tragic 2.8% |
| Mexican American Indians | 0.0 /100 | #304 | Tragic 2.8% |
| Hispanics or Latinos | 0.0 /100 | #305 | Tragic 2.8% |
| Immigrants | Azores | 0.0 /100 | #306 | Tragic 2.8% |
| Hopi | 0.0 /100 | #307 | Tragic 2.8% |
| Apache | 0.0 /100 | #308 | Tragic 2.8% |
| Central Americans | 0.0 /100 | #309 | Tragic 2.9% |
| Immigrants | Laos | 0.0 /100 | #310 | Tragic 2.9% |
| Spanish American Indians | 0.0 /100 | #311 | Tragic 2.9% |
| Tsimshian | 0.0 /100 | #312 | Tragic 2.9% |
| Arapaho | 0.0 /100 | #313 | Tragic 2.9% |
| Salvadorans | 0.0 /100 | #314 | Tragic 2.9% |
| Cheyenne | 0.0 /100 | #315 | Tragic 2.9% |