Yup'ik vs Immigrants from Nepal Single Father Households

COMPARE

Yup'ik
Race
Ancestry
AfghanAfricanAlaska NativeAlaskan AthabascanAlbanianAleutAlsatianAmericanApacheArabArapahoArgentineanArmenianAssyrian/Chaldean/SyriacAustralianAustrianBahamianBangladeshiBarbadianBasqueBelgianBelizeanBermudanBhutaneseBlackfeetBolivianBrazilianBritishBritish West IndianBulgarianBurmeseCajunCambodianCanadianCape VerdeanCarpatho RusynCelticCentral AmericanCentral American IndianCherokeeCheyenneChickasawChileanChineseChippewaChoctawColombianColvilleComancheCosta RicanCreeCreekCroatianCrowCubanCypriotCzechCzechoslovakianDanishDelawareDominicanDutchDutch West IndianEastern EuropeanEcuadorianEgyptianEnglishEstonianEthiopianEuropeanFijianFilipinoFinnishFrenchFrench American IndianFrench CanadianGermanGerman RussianGhanaianGreekGuamanian/ChamorroGuatemalanGuyaneseHaitianHmongHonduranHopiHoumaHungarianIcelanderIndian (Asian)IndonesianInupiatIranianIraqiIrishIroquoisIsraeliItalianJamaicanJapaneseJordanianKenyanKiowaKoreanLaotianLatvianLebaneseLiberianLithuanianLumbeeLuxembourgerMacedonianMalaysianMalteseMarshalleseMenomineeMexicanMexican American IndianMongolianMoroccanNative HawaiianNavajoNepaleseNew ZealanderNicaraguanNigerianNorthern EuropeanNorwegianOkinawanOsageOttawaPaiutePakistaniPalestinianPanamanianParaguayanPennsylvania GermanPeruvianPimaPolishPortuguesePotawatomiPuebloPuerto RicanPuget Sound SalishRomanianRussianSalvadoranSamoanScandinavianScotch-IrishScottishSeminoleSenegaleseSerbianShoshoneSierra LeoneanSiouxSlavicSlovakSloveneSomaliSouth AfricanSouth AmericanSouth American IndianSoviet UnionSpaniardSpanishSpanish AmericanSpanish American IndianSri LankanSubsaharan AfricanSudaneseSwedishSwissSyrianTaiwaneseThaiTlingit-HaidaTohono O'OdhamTonganTrinidadian and TobagonianTsimshianTurkishU.S. Virgin IslanderUgandanUkrainianUruguayanUteVenezuelanVietnameseWelshWest IndianYakamaYaquiYugoslavianYumanYup'ikZimbabwean
Immigration
NonimmigrantsImmigrantsAfghanistanAfricaAlbaniaArgentinaArmeniaAsiaAustraliaAustriaBahamasBangladeshBarbadosBelarusBelgiumBelizeBoliviaBosnia and HerzegovinaBrazilBulgariaBurma/MyanmarCabo VerdeCambodiaCameroonCanadaCaribbeanCentral AmericaChileChinaColombiaCongoCosta RicaCroatiaCubaCzechoslovakiaDenmarkDominicaDominican RepublicEastern AfricaEastern AsiaEastern EuropeEcuadorEgyptEl SalvadorEnglandEritreaEthiopiaEuropeFijiFranceGermanyGhanaGreeceGrenadaGuatemalaGuyanaHaitiHondurasHong KongHungaryIndiaIndonesiaIranIraqIrelandIsraelItalyJamaicaJapanJordanKazakhstanKenyaKoreaKuwaitLaosLatin AmericaLatviaLebanonLiberiaLithuaniaMalaysiaMexicoMicronesiaMiddle AfricaMoldovaMoroccoNetherlandsNicaraguaNigeriaNorth AmericaNorth MacedoniaNorthern AfricaNorthern EuropeNorwayOceaniaPakistanPanamaPeruPhilippinesPolandPortugalRomaniaRussiaSaudi ArabiaScotlandSenegalSerbiaSierra LeoneSingaporeSomaliaSouth AfricaSouth AmericaSouth Central AsiaSouth Eastern AsiaSouthern EuropeSpainSri LankaSt. Vincent and the GrenadinesSudanSwedenSwitzerlandSyriaTaiwanThailandTrinidad and TobagoTurkeyUgandaUkraineUruguayUzbekistanVenezuelaVietnamWest IndiesWestern AfricaWestern AsiaWestern EuropeYemenZaireZimbabweAzores
Immigrants from Nepal
Race
Ancestry
AfghanAfricanAlaska NativeAlaskan AthabascanAlbanianAleutAlsatianAmericanApacheArabArapahoArgentineanArmenianAssyrian/Chaldean/SyriacAustralianAustrianBahamianBangladeshiBarbadianBasqueBelgianBelizeanBermudanBhutaneseBlackfeetBolivianBrazilianBritishBritish West IndianBulgarianBurmeseCajunCambodianCanadianCape VerdeanCarpatho RusynCelticCentral AmericanCentral American IndianCherokeeCheyenneChickasawChileanChineseChippewaChoctawColombianColvilleComancheCosta RicanCreeCreekCroatianCrowCubanCypriotCzechCzechoslovakianDanishDelawareDominicanDutchDutch West IndianEastern EuropeanEcuadorianEgyptianEnglishEstonianEthiopianEuropeanFijianFilipinoFinnishFrenchFrench American IndianFrench CanadianGermanGerman RussianGhanaianGreekGuamanian/ChamorroGuatemalanGuyaneseHaitianHmongHonduranHopiHoumaHungarianIcelanderIndian (Asian)IndonesianInupiatIranianIraqiIrishIroquoisIsraeliItalianJamaicanJapaneseJordanianKenyanKiowaKoreanLaotianLatvianLebaneseLiberianLithuanianLumbeeLuxembourgerMacedonianMalaysianMalteseMarshalleseMenomineeMexicanMexican American IndianMongolianMoroccanNative HawaiianNavajoNepaleseNew ZealanderNicaraguanNigerianNorthern EuropeanNorwegianOkinawanOsageOttawaPaiutePakistaniPalestinianPanamanianParaguayanPennsylvania GermanPeruvianPimaPolishPortuguesePotawatomiPuebloPuerto RicanPuget Sound SalishRomanianRussianSalvadoranSamoanScandinavianScotch-IrishScottishSeminoleSenegaleseSerbianShoshoneSierra LeoneanSiouxSlavicSlovakSloveneSomaliSouth AfricanSouth AmericanSouth American IndianSoviet UnionSpaniardSpanishSpanish AmericanSpanish American IndianSri LankanSubsaharan AfricanSudaneseSwedishSwissSyrianTaiwaneseThaiTlingit-HaidaTohono O'OdhamTonganTrinidadian and TobagonianTsimshianTurkishU.S. Virgin IslanderUgandanUkrainianUruguayanUteVenezuelanVietnameseWelshWest IndianYakamaYaquiYugoslavianYumanZimbabwean
Immigration
NonimmigrantsImmigrantsAfghanistanAfricaAlbaniaArgentinaArmeniaAsiaAustraliaAustriaBahamasBangladeshBarbadosBelarusBelgiumBelizeBoliviaBosnia and HerzegovinaBrazilBulgariaBurma/MyanmarCabo VerdeCambodiaCameroonCanadaCaribbeanCentral AmericaChileChinaColombiaCongoCosta RicaCroatiaCubaCzechoslovakiaDenmarkDominicaDominican RepublicEastern AfricaEastern AsiaEastern EuropeEcuadorEgyptEl SalvadorEnglandEritreaEthiopiaEuropeFijiFranceGermanyGhanaGreeceGrenadaGuatemalaGuyanaHaitiHondurasHong KongHungaryIndiaIndonesiaIranIraqIrelandIsraelItalyJamaicaJapanJordanKazakhstanKenyaKoreaKuwaitLaosLatin AmericaLatviaLebanonLiberiaLithuaniaMalaysiaMexicoMicronesiaMiddle AfricaMoldovaMoroccoNepalNetherlandsNicaraguaNigeriaNorth AmericaNorth MacedoniaNorthern AfricaNorthern EuropeNorwayOceaniaPakistanPanamaPeruPhilippinesPolandPortugalRomaniaRussiaSaudi ArabiaScotlandSenegalSerbiaSierra LeoneSingaporeSomaliaSouth AfricaSouth AmericaSouth Central AsiaSouth Eastern AsiaSouthern EuropeSpainSri LankaSt. Vincent and the GrenadinesSudanSwedenSwitzerlandSyriaTaiwanThailandTrinidad and TobagoTurkeyUgandaUkraineUruguayUzbekistanVenezuelaVietnamWest IndiesWestern AfricaWestern AsiaWestern EuropeYemenZaireZimbabweAzores
Single Father Households
Income
Poverty
Unemployment
Labor Participation
Family Structure
Vehicle Availability
Education Level
Disability

Single Father Households Comparison

Yup'ik

Immigrants from Nepal

Tragic
Exceptional
5.4%
SINGLE FATHER HOUSEHOLDS
0.0/ 100
METRIC RATING
347th/ 347
METRIC RANK
2.2%
SINGLE FATHER HOUSEHOLDS
92.1/ 100
METRIC RATING
143rd/ 347
METRIC RANK

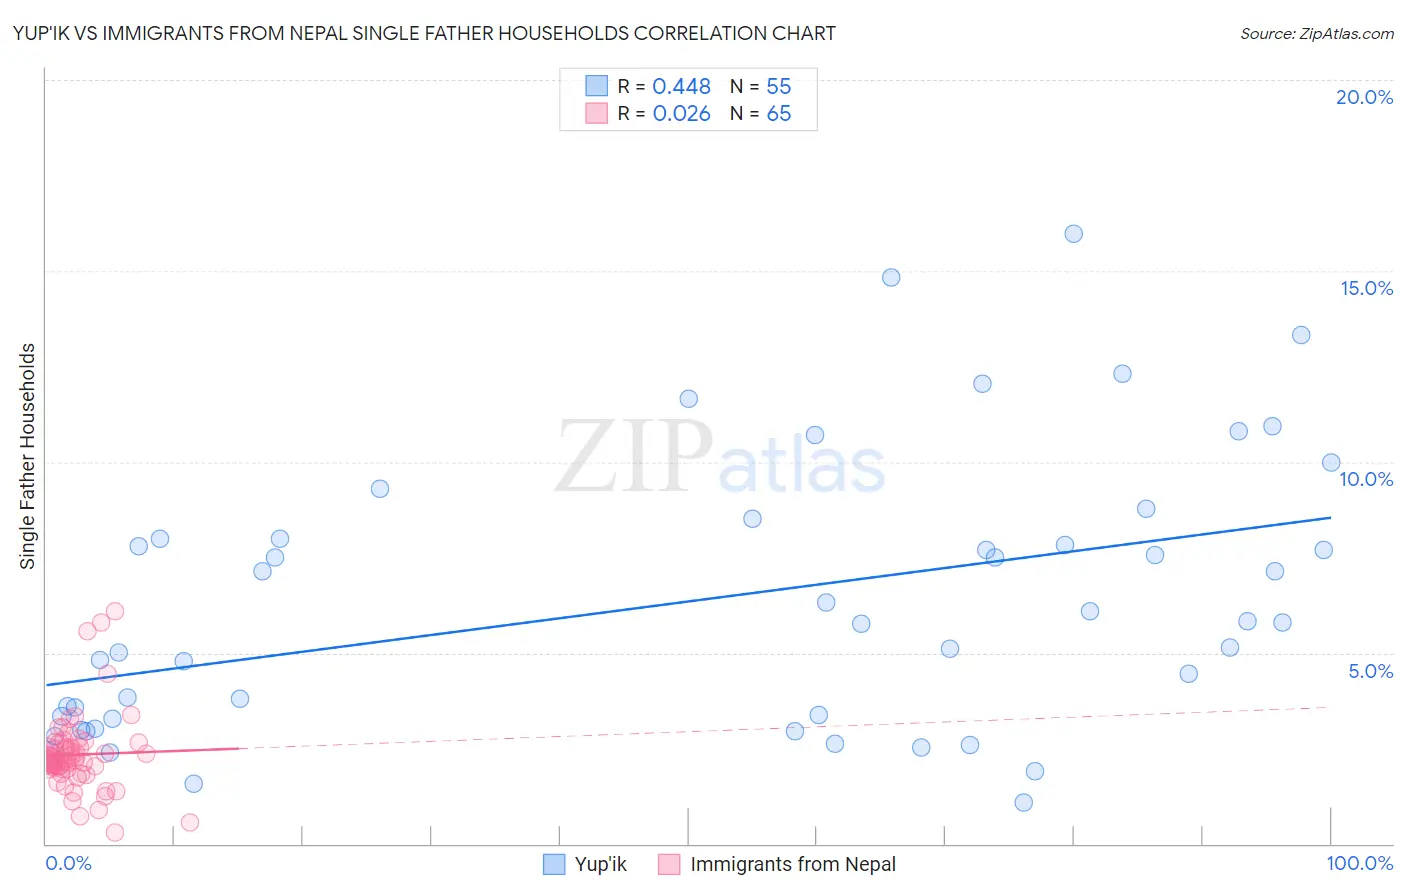
Yup'ik vs Immigrants from Nepal Single Father Households Correlation Chart

The statistical analysis conducted on geographies consisting of 39,844,745 people shows a moderate positive correlation between the proportion of Yup'ik and percentage of single father households in the United States with a correlation coefficient (R) of 0.448 and weighted average of 5.4%. Similarly, the statistical analysis conducted on geographies consisting of 186,164,733 people shows no correlation between the proportion of Immigrants from Nepal and percentage of single father households in the United States with a correlation coefficient (R) of 0.026 and weighted average of 2.2%, a difference of 141.1%.
Yup'ik vs Immigrants from Nepal Single Father Households

Single Father Households Correlation Summary

MeasurementYup'ikImmigrants from Nepal
Minimum1.1%0.28%
Maximum16.0%6.1%
Range14.9%5.8%
Mean6.3%2.3%
Median5.8%2.2%
Interquartile 25% (IQ1)3.3%2.0%
Interquartile 75% (IQ3)8.0%2.6%
Interquartile Range (IQR)4.7%0.61%
Standard Deviation (Sample)3.6%1.0%
Standard Deviation (Population)3.5%1.0%

Similar Demographics by Single Father Households

Demographics Similar to Yup'ik by Single Father Households

In terms of single father households, the demographic groups most similar to Yup'ik are Inupiat (4.9%, a difference of 10.7%), Menominee (4.2%, a difference of 27.7%), Yakama (4.2%, a difference of 28.6%), Pima (4.2%, a difference of 28.9%), and Tohono O'odham (3.8%, a difference of 40.8%).
DemographicsRating | RankSingle Father Households
Natives/Alaskans
0.0
/100
|
#333
Tragic
3.2%
Yuman
0.0
/100
|
#334
Tragic
3.3%
Colville
0.0
/100
|
#335
Tragic
3.3%
Paiute
0.0
/100
|
#336
Tragic
3.3%
Pueblo
0.0
/100
|
#337
Tragic
3.3%
Sioux
0.0
/100
|
#338
Tragic
3.3%
Alaskan Athabascans
0.0
/100
|
#339
Tragic
3.4%
Alaska Natives
0.0
/100
|
#340
Tragic
3.5%
Crow
0.0
/100
|
#341
Tragic
3.5%
Tohono O'odham
0.0
/100
|
#342
Tragic
3.8%
Pima
0.0
/100
|
#343
Tragic
4.2%
Yakama
0.0
/100
|
#344
Tragic
4.2%
Menominee
0.0
/100
|
#345
Tragic
4.2%
Inupiat
0.0
/100
|
#346
Tragic
4.9%
Yup'ik
0.0
/100
|
#347
Tragic
5.4%

Demographics Similar to Immigrants from Nepal by Single Father Households

In terms of single father households, the demographic groups most similar to Immigrants from Nepal are Luxembourger (2.2%, a difference of 0.060%), Laotian (2.2%, a difference of 0.10%), Brazilian (2.2%, a difference of 0.19%), British (2.2%, a difference of 0.19%), and Slovak (2.2%, a difference of 0.34%).
DemographicsRating | RankSingle Father Households
Chileans
94.5
/100
|
#136
Exceptional
2.2%
Austrians
94.2
/100
|
#137
Exceptional
2.2%
West Indians
94.1
/100
|
#138
Exceptional
2.2%
Brazilians
92.8
/100
|
#139
Exceptional
2.2%
British
92.8
/100
|
#140
Exceptional
2.2%
Laotians
92.5
/100
|
#141
Exceptional
2.2%
Luxembourgers
92.3
/100
|
#142
Exceptional
2.2%
Immigrants | Nepal
92.1
/100
|
#143
Exceptional
2.2%
Slovaks
90.7
/100
|
#144
Exceptional
2.2%
Immigrants | Zimbabwe
90.2
/100
|
#145
Exceptional
2.2%
Northern Europeans
89.8
/100
|
#146
Excellent
2.2%
Slavs
88.9
/100
|
#147
Excellent
2.2%
South American Indians
88.5
/100
|
#148
Excellent
2.3%
Senegalese
88.4
/100
|
#149
Excellent
2.3%
Venezuelans
86.2
/100
|
#150
Excellent
2.3%