Yup'ik vs Immigrants from Belize Single Father Households
COMPARE
Yup'ik
Immigrants from Belize
Single Father Households
Single Father Households Comparison
Yup'ik
Immigrants from Belize
5.4%
SINGLE FATHER HOUSEHOLDS
0.0/ 100
METRIC RATING
347th/ 347
METRIC RANK
2.5%
SINGLE FATHER HOUSEHOLDS
0.9/ 100
METRIC RATING
261st/ 347
METRIC RANK
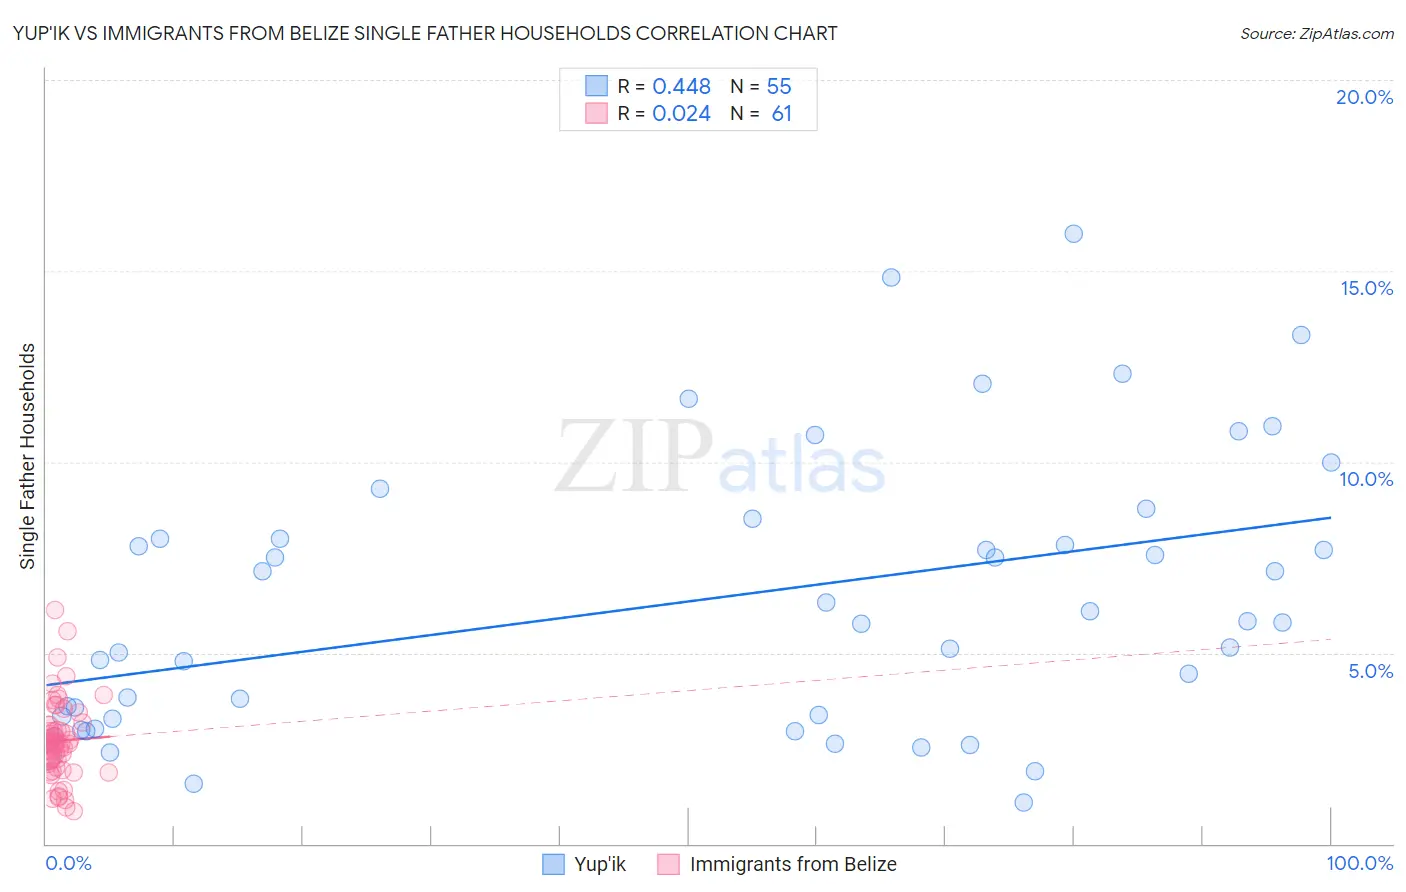
Yup'ik vs Immigrants from Belize Single Father Households Correlation Chart
The statistical analysis conducted on geographies consisting of 39,844,745 people shows a moderate positive correlation between the proportion of Yup'ik and percentage of single father households in the United States with a correlation coefficient (R) of 0.448 and weighted average of 5.4%. Similarly, the statistical analysis conducted on geographies consisting of 129,846,095 people shows no correlation between the proportion of Immigrants from Belize and percentage of single father households in the United States with a correlation coefficient (R) of 0.024 and weighted average of 2.5%, a difference of 111.9%.
Single Father Households Correlation Summary
| Measurement | Yup'ik | Immigrants from Belize |
| Minimum | 1.1% | 0.87% |
| Maximum | 16.0% | 6.1% |
| Range | 14.9% | 5.3% |
| Mean | 6.3% | 2.7% |
| Median | 5.8% | 2.6% |
| Interquartile 25% (IQ1) | 3.3% | 2.1% |
| Interquartile 75% (IQ3) | 8.0% | 3.1% |
| Interquartile Range (IQR) | 4.7% | 1.0% |
| Standard Deviation (Sample) | 3.6% | 1.0% |
| Standard Deviation (Population) | 3.5% | 1.0% |
Similar Demographics by Single Father Households
Demographics Similar to Yup'ik by Single Father Households
In terms of single father households, the demographic groups most similar to Yup'ik are Inupiat (4.9%, a difference of 10.7%), Menominee (4.2%, a difference of 27.7%), Yakama (4.2%, a difference of 28.6%), Pima (4.2%, a difference of 28.9%), and Tohono O'odham (3.8%, a difference of 40.8%).
| Demographics | Rating | Rank | Single Father Households |
| Natives/Alaskans | 0.0 /100 | #333 | Tragic 3.2% |
| Yuman | 0.0 /100 | #334 | Tragic 3.3% |
| Colville | 0.0 /100 | #335 | Tragic 3.3% |
| Paiute | 0.0 /100 | #336 | Tragic 3.3% |
| Pueblo | 0.0 /100 | #337 | Tragic 3.3% |
| Sioux | 0.0 /100 | #338 | Tragic 3.3% |
| Alaskan Athabascans | 0.0 /100 | #339 | Tragic 3.4% |
| Alaska Natives | 0.0 /100 | #340 | Tragic 3.5% |
| Crow | 0.0 /100 | #341 | Tragic 3.5% |
| Tohono O'odham | 0.0 /100 | #342 | Tragic 3.8% |
| Pima | 0.0 /100 | #343 | Tragic 4.2% |
| Yakama | 0.0 /100 | #344 | Tragic 4.2% |
| Menominee | 0.0 /100 | #345 | Tragic 4.2% |
| Inupiat | 0.0 /100 | #346 | Tragic 4.9% |
| Yup'ik | 0.0 /100 | #347 | Tragic 5.4% |
Demographics Similar to Immigrants from Belize by Single Father Households
In terms of single father households, the demographic groups most similar to Immigrants from Belize are Immigrants from Liberia (2.5%, a difference of 0.15%), Immigrants from Caribbean (2.5%, a difference of 0.16%), Comanche (2.5%, a difference of 0.25%), Dominican (2.5%, a difference of 0.28%), and Spanish (2.5%, a difference of 0.40%).
| Demographics | Rating | Rank | Single Father Households |
| Immigrants | Thailand | 1.8 /100 | #254 | Tragic 2.5% |
| Tongans | 1.5 /100 | #255 | Tragic 2.5% |
| Potawatomi | 1.4 /100 | #256 | Tragic 2.5% |
| Immigrants | Congo | 1.2 /100 | #257 | Tragic 2.5% |
| Spanish | 1.1 /100 | #258 | Tragic 2.5% |
| Comanche | 1.0 /100 | #259 | Tragic 2.5% |
| Immigrants | Caribbean | 1.0 /100 | #260 | Tragic 2.5% |
| Immigrants | Belize | 0.9 /100 | #261 | Tragic 2.5% |
| Immigrants | Liberia | 0.8 /100 | #262 | Tragic 2.5% |
| Dominicans | 0.8 /100 | #263 | Tragic 2.5% |
| Indonesians | 0.5 /100 | #264 | Tragic 2.6% |
| Immigrants | Micronesia | 0.5 /100 | #265 | Tragic 2.6% |
| French American Indians | 0.5 /100 | #266 | Tragic 2.6% |
| Guamanians/Chamorros | 0.4 /100 | #267 | Tragic 2.6% |
| Haitians | 0.4 /100 | #268 | Tragic 2.6% |