Maltese vs Apache Single Father Households
COMPARE
Maltese
Apache
Single Father Households
Single Father Households Comparison
Maltese
Apache
2.0%
SINGLE FATHER HOUSEHOLDS
99.9/ 100
METRIC RATING
63rd/ 347
METRIC RANK
2.8%
SINGLE FATHER HOUSEHOLDS
0.0/ 100
METRIC RATING
308th/ 347
METRIC RANK
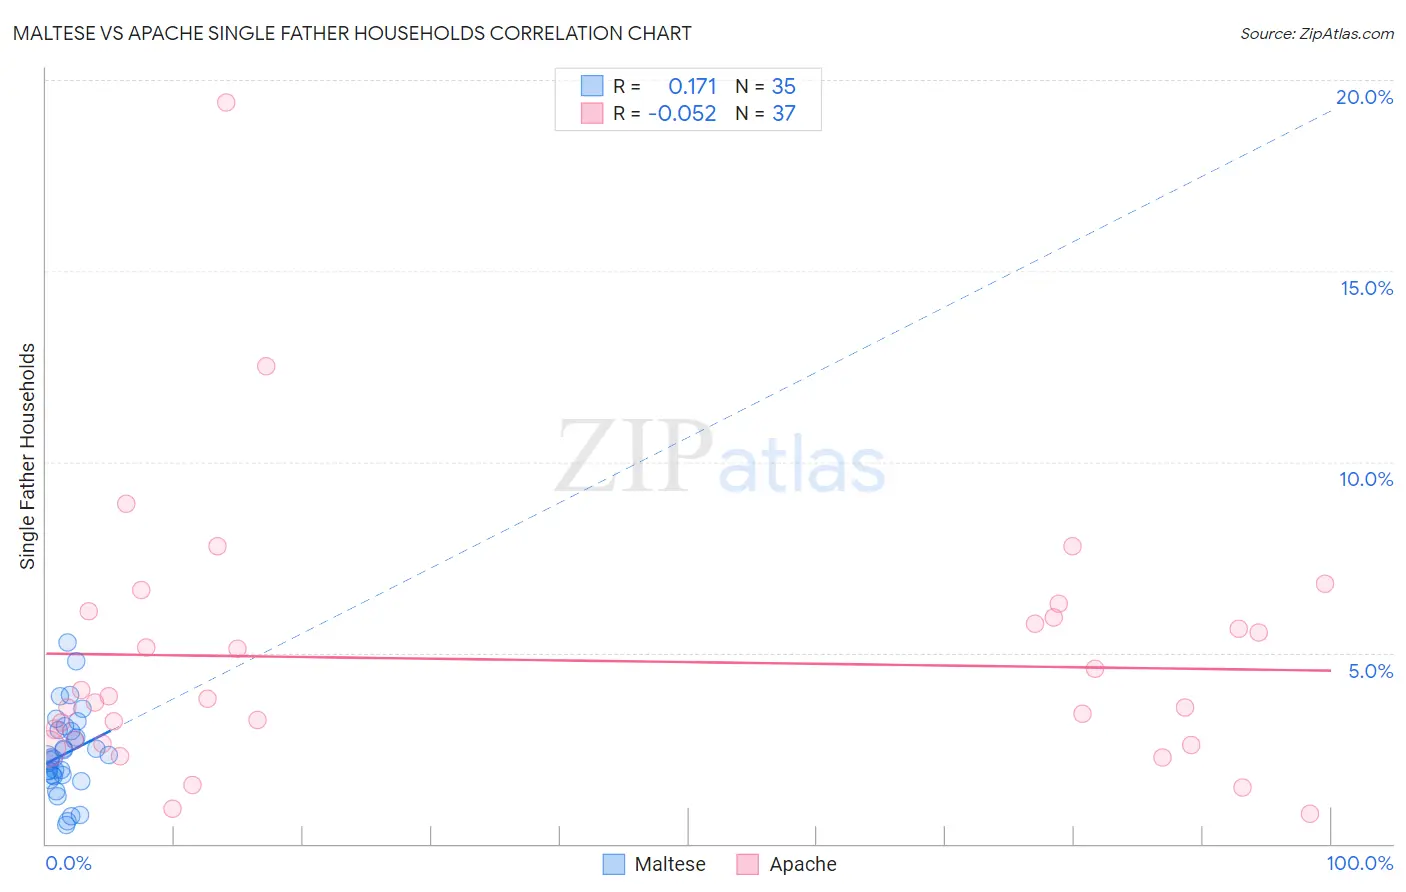
Maltese vs Apache Single Father Households Correlation Chart
The statistical analysis conducted on geographies consisting of 125,770,300 people shows a poor positive correlation between the proportion of Maltese and percentage of single father households in the United States with a correlation coefficient (R) of 0.171 and weighted average of 2.0%. Similarly, the statistical analysis conducted on geographies consisting of 230,074,281 people shows a slight negative correlation between the proportion of Apache and percentage of single father households in the United States with a correlation coefficient (R) of -0.052 and weighted average of 2.8%, a difference of 38.3%.
Single Father Households Correlation Summary
| Measurement | Maltese | Apache |
| Minimum | 0.48% | 0.80% |
| Maximum | 5.3% | 19.4% |
| Range | 4.8% | 18.6% |
| Mean | 2.4% | 4.8% |
| Median | 2.2% | 3.8% |
| Interquartile 25% (IQ1) | 1.8% | 2.7% |
| Interquartile 75% (IQ3) | 3.0% | 6.0% |
| Interquartile Range (IQR) | 1.2% | 3.3% |
| Standard Deviation (Sample) | 1.1% | 3.4% |
| Standard Deviation (Population) | 1.1% | 3.4% |
Similar Demographics by Single Father Households
Demographics Similar to Maltese by Single Father Households
In terms of single father households, the demographic groups most similar to Maltese are Mongolian (2.1%, a difference of 0.14%), Paraguayan (2.1%, a difference of 0.17%), Immigrants from Malaysia (2.0%, a difference of 0.20%), Vietnamese (2.0%, a difference of 0.39%), and Immigrants from Western Asia (2.1%, a difference of 0.53%).
| Demographics | Rating | Rank | Single Father Households |
| Immigrants | Norway | 99.9 /100 | #56 | Exceptional 2.0% |
| Burmese | 99.9 /100 | #57 | Exceptional 2.0% |
| Immigrants | Czechoslovakia | 99.9 /100 | #58 | Exceptional 2.0% |
| Immigrants | North Macedonia | 99.9 /100 | #59 | Exceptional 2.0% |
| Immigrants | Austria | 99.9 /100 | #60 | Exceptional 2.0% |
| Vietnamese | 99.9 /100 | #61 | Exceptional 2.0% |
| Immigrants | Malaysia | 99.9 /100 | #62 | Exceptional 2.0% |
| Maltese | 99.9 /100 | #63 | Exceptional 2.0% |
| Mongolians | 99.9 /100 | #64 | Exceptional 2.1% |
| Paraguayans | 99.9 /100 | #65 | Exceptional 2.1% |
| Immigrants | Western Asia | 99.8 /100 | #66 | Exceptional 2.1% |
| Immigrants | Italy | 99.8 /100 | #67 | Exceptional 2.1% |
| Immigrants | Denmark | 99.8 /100 | #68 | Exceptional 2.1% |
| Immigrants | Romania | 99.8 /100 | #69 | Exceptional 2.1% |
| Egyptians | 99.8 /100 | #70 | Exceptional 2.1% |
Demographics Similar to Apache by Single Father Households
In terms of single father households, the demographic groups most similar to Apache are Hopi (2.8%, a difference of 0.18%), Immigrants from the Azores (2.8%, a difference of 0.35%), Hispanic or Latino (2.8%, a difference of 0.50%), Mexican American Indian (2.8%, a difference of 0.66%), and Central American (2.9%, a difference of 0.71%).
| Demographics | Rating | Rank | Single Father Households |
| Immigrants | Latin America | 0.0 /100 | #301 | Tragic 2.8% |
| Spanish Americans | 0.0 /100 | #302 | Tragic 2.8% |
| Immigrants | Honduras | 0.0 /100 | #303 | Tragic 2.8% |
| Mexican American Indians | 0.0 /100 | #304 | Tragic 2.8% |
| Hispanics or Latinos | 0.0 /100 | #305 | Tragic 2.8% |
| Immigrants | Azores | 0.0 /100 | #306 | Tragic 2.8% |
| Hopi | 0.0 /100 | #307 | Tragic 2.8% |
| Apache | 0.0 /100 | #308 | Tragic 2.8% |
| Central Americans | 0.0 /100 | #309 | Tragic 2.9% |
| Immigrants | Laos | 0.0 /100 | #310 | Tragic 2.9% |
| Spanish American Indians | 0.0 /100 | #311 | Tragic 2.9% |
| Tsimshian | 0.0 /100 | #312 | Tragic 2.9% |
| Arapaho | 0.0 /100 | #313 | Tragic 2.9% |
| Salvadorans | 0.0 /100 | #314 | Tragic 2.9% |
| Cheyenne | 0.0 /100 | #315 | Tragic 2.9% |