Immigrants from South Africa vs Apache Single Father Households
COMPARE
Immigrants from South Africa
Apache
Single Father Households
Single Father Households Comparison
Immigrants from South Africa
Apache
2.1%
SINGLE FATHER HOUSEHOLDS
99.7/ 100
METRIC RATING
80th/ 347
METRIC RANK
2.8%
SINGLE FATHER HOUSEHOLDS
0.0/ 100
METRIC RATING
308th/ 347
METRIC RANK
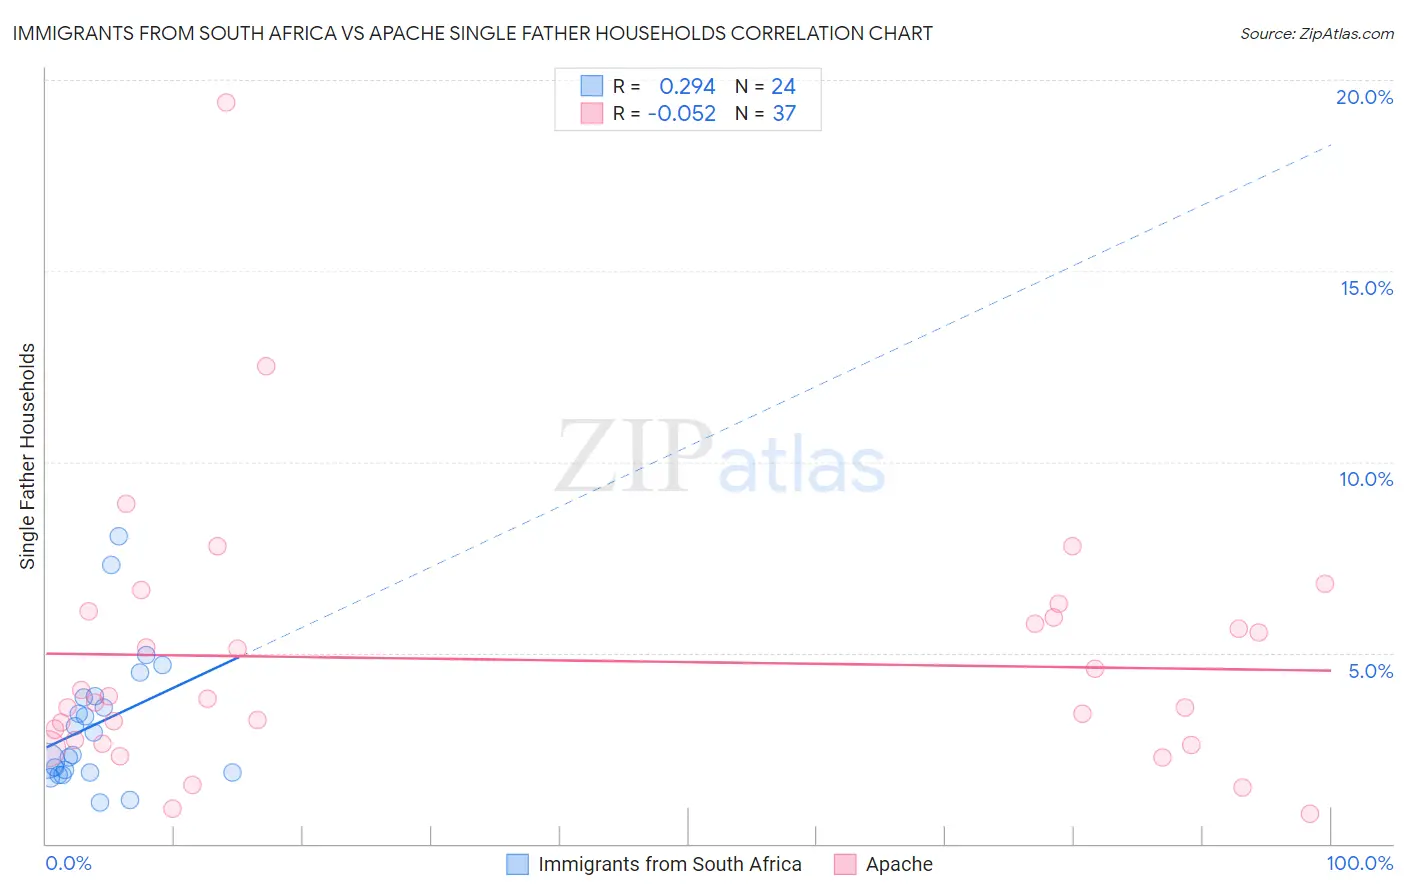
Immigrants from South Africa vs Apache Single Father Households Correlation Chart
The statistical analysis conducted on geographies consisting of 231,943,382 people shows a weak positive correlation between the proportion of Immigrants from South Africa and percentage of single father households in the United States with a correlation coefficient (R) of 0.294 and weighted average of 2.1%. Similarly, the statistical analysis conducted on geographies consisting of 230,074,281 people shows a slight negative correlation between the proportion of Apache and percentage of single father households in the United States with a correlation coefficient (R) of -0.052 and weighted average of 2.8%, a difference of 35.7%.
Single Father Households Correlation Summary
| Measurement | Immigrants from South Africa | Apache |
| Minimum | 1.1% | 0.80% |
| Maximum | 8.1% | 19.4% |
| Range | 7.0% | 18.6% |
| Mean | 3.1% | 4.8% |
| Median | 2.6% | 3.8% |
| Interquartile 25% (IQ1) | 1.9% | 2.7% |
| Interquartile 75% (IQ3) | 3.8% | 6.0% |
| Interquartile Range (IQR) | 2.0% | 3.3% |
| Standard Deviation (Sample) | 1.8% | 3.4% |
| Standard Deviation (Population) | 1.7% | 3.4% |
Similar Demographics by Single Father Households
Demographics Similar to Immigrants from South Africa by Single Father Households
In terms of single father households, the demographic groups most similar to Immigrants from South Africa are Armenian (2.1%, a difference of 0.080%), Immigrants from Asia (2.1%, a difference of 0.090%), New Zealander (2.1%, a difference of 0.13%), Greek (2.1%, a difference of 0.14%), and Estonian (2.1%, a difference of 0.20%).
| Demographics | Rating | Rank | Single Father Households |
| Immigrants | Bangladesh | 99.8 /100 | #73 | Exceptional 2.1% |
| Immigrants | Egypt | 99.8 /100 | #74 | Exceptional 2.1% |
| Immigrants | Sweden | 99.8 /100 | #75 | Exceptional 2.1% |
| Immigrants | Scotland | 99.8 /100 | #76 | Exceptional 2.1% |
| Immigrants | Saudi Arabia | 99.8 /100 | #77 | Exceptional 2.1% |
| Estonians | 99.7 /100 | #78 | Exceptional 2.1% |
| Immigrants | Asia | 99.7 /100 | #79 | Exceptional 2.1% |
| Immigrants | South Africa | 99.7 /100 | #80 | Exceptional 2.1% |
| Armenians | 99.7 /100 | #81 | Exceptional 2.1% |
| New Zealanders | 99.7 /100 | #82 | Exceptional 2.1% |
| Greeks | 99.7 /100 | #83 | Exceptional 2.1% |
| Carpatho Rusyns | 99.6 /100 | #84 | Exceptional 2.1% |
| Immigrants | Hungary | 99.6 /100 | #85 | Exceptional 2.1% |
| Asians | 99.6 /100 | #86 | Exceptional 2.1% |
| Lithuanians | 99.5 /100 | #87 | Exceptional 2.1% |
Demographics Similar to Apache by Single Father Households
In terms of single father households, the demographic groups most similar to Apache are Hopi (2.8%, a difference of 0.18%), Immigrants from the Azores (2.8%, a difference of 0.35%), Hispanic or Latino (2.8%, a difference of 0.50%), Mexican American Indian (2.8%, a difference of 0.66%), and Central American (2.9%, a difference of 0.71%).
| Demographics | Rating | Rank | Single Father Households |
| Immigrants | Latin America | 0.0 /100 | #301 | Tragic 2.8% |
| Spanish Americans | 0.0 /100 | #302 | Tragic 2.8% |
| Immigrants | Honduras | 0.0 /100 | #303 | Tragic 2.8% |
| Mexican American Indians | 0.0 /100 | #304 | Tragic 2.8% |
| Hispanics or Latinos | 0.0 /100 | #305 | Tragic 2.8% |
| Immigrants | Azores | 0.0 /100 | #306 | Tragic 2.8% |
| Hopi | 0.0 /100 | #307 | Tragic 2.8% |
| Apache | 0.0 /100 | #308 | Tragic 2.8% |
| Central Americans | 0.0 /100 | #309 | Tragic 2.9% |
| Immigrants | Laos | 0.0 /100 | #310 | Tragic 2.9% |
| Spanish American Indians | 0.0 /100 | #311 | Tragic 2.9% |
| Tsimshian | 0.0 /100 | #312 | Tragic 2.9% |
| Arapaho | 0.0 /100 | #313 | Tragic 2.9% |
| Salvadorans | 0.0 /100 | #314 | Tragic 2.9% |
| Cheyenne | 0.0 /100 | #315 | Tragic 2.9% |