Yuman vs Ute Single Father Households
COMPARE
Yuman
Ute
Single Father Households
Single Father Households Comparison
Yuman
Ute
3.3%
SINGLE FATHER HOUSEHOLDS
0.0/ 100
METRIC RATING
334th/ 347
METRIC RANK
3.0%
SINGLE FATHER HOUSEHOLDS
0.0/ 100
METRIC RATING
319th/ 347
METRIC RANK
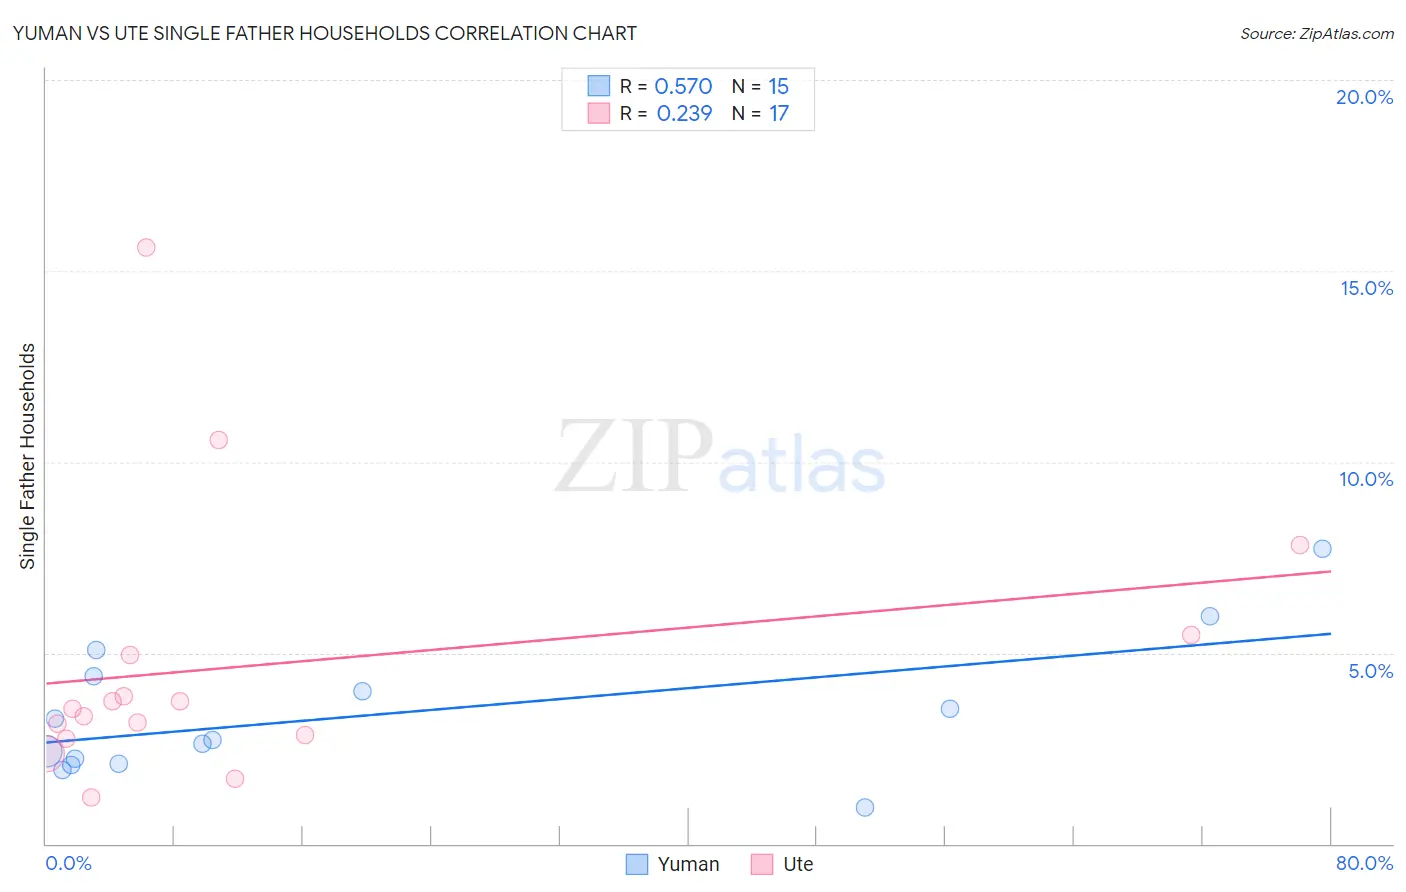
Yuman vs Ute Single Father Households Correlation Chart
The statistical analysis conducted on geographies consisting of 40,610,556 people shows a substantial positive correlation between the proportion of Yuman and percentage of single father households in the United States with a correlation coefficient (R) of 0.570 and weighted average of 3.3%. Similarly, the statistical analysis conducted on geographies consisting of 55,604,261 people shows a weak positive correlation between the proportion of Ute and percentage of single father households in the United States with a correlation coefficient (R) of 0.239 and weighted average of 3.0%, a difference of 11.2%.
Single Father Households Correlation Summary
| Measurement | Yuman | Ute |
| Minimum | 0.94% | 1.2% |
| Maximum | 7.7% | 15.6% |
| Range | 6.8% | 14.4% |
| Mean | 3.4% | 4.7% |
| Median | 2.7% | 3.5% |
| Interquartile 25% (IQ1) | 2.1% | 2.8% |
| Interquartile 75% (IQ3) | 4.4% | 5.2% |
| Interquartile Range (IQR) | 2.3% | 2.4% |
| Standard Deviation (Sample) | 1.8% | 3.6% |
| Standard Deviation (Population) | 1.7% | 3.5% |
Demographics Similar to Yuman and Ute by Single Father Households
In terms of single father households, the demographic groups most similar to Yuman are Colville (3.3%, a difference of 0.020%), Paiute (3.3%, a difference of 0.050%), Native/Alaskan (3.2%, a difference of 2.8%), Yaqui (3.2%, a difference of 3.3%), and Navajo (3.2%, a difference of 3.3%). Similarly, the demographic groups most similar to Ute are Guatemalan (3.0%, a difference of 0.080%), Mexican (3.0%, a difference of 0.47%), Cape Verdean (2.9%, a difference of 0.53%), Immigrants from El Salvador (2.9%, a difference of 0.54%), and Immigrants from Guatemala (3.0%, a difference of 1.0%).
| Demographics | Rating | Rank | Single Father Households |
| Houma | 0.0 /100 | #316 | Tragic 2.9% |
| Immigrants | El Salvador | 0.0 /100 | #317 | Tragic 2.9% |
| Cape Verdeans | 0.0 /100 | #318 | Tragic 2.9% |
| Ute | 0.0 /100 | #319 | Tragic 3.0% |
| Guatemalans | 0.0 /100 | #320 | Tragic 3.0% |
| Mexicans | 0.0 /100 | #321 | Tragic 3.0% |
| Immigrants | Guatemala | 0.0 /100 | #322 | Tragic 3.0% |
| Immigrants | Central America | 0.0 /100 | #323 | Tragic 3.0% |
| Fijians | 0.0 /100 | #324 | Tragic 3.0% |
| Immigrants | Mexico | 0.0 /100 | #325 | Tragic 3.0% |
| Aleuts | 0.0 /100 | #326 | Tragic 3.0% |
| Bangladeshis | 0.0 /100 | #327 | Tragic 3.1% |
| Immigrants | Cabo Verde | 0.0 /100 | #328 | Tragic 3.1% |
| Chippewa | 0.0 /100 | #329 | Tragic 3.1% |
| Nepalese | 0.0 /100 | #330 | Tragic 3.1% |
| Navajo | 0.0 /100 | #331 | Tragic 3.2% |
| Yaqui | 0.0 /100 | #332 | Tragic 3.2% |
| Natives/Alaskans | 0.0 /100 | #333 | Tragic 3.2% |
| Yuman | 0.0 /100 | #334 | Tragic 3.3% |
| Colville | 0.0 /100 | #335 | Tragic 3.3% |
| Paiute | 0.0 /100 | #336 | Tragic 3.3% |