Yuman vs Delaware Single Father Households
COMPARE
Yuman
Delaware
Single Father Households
Single Father Households Comparison
Yuman
Delaware
3.3%
SINGLE FATHER HOUSEHOLDS
0.0/ 100
METRIC RATING
334th/ 347
METRIC RANK
2.5%
SINGLE FATHER HOUSEHOLDS
2.5/ 100
METRIC RATING
247th/ 347
METRIC RANK
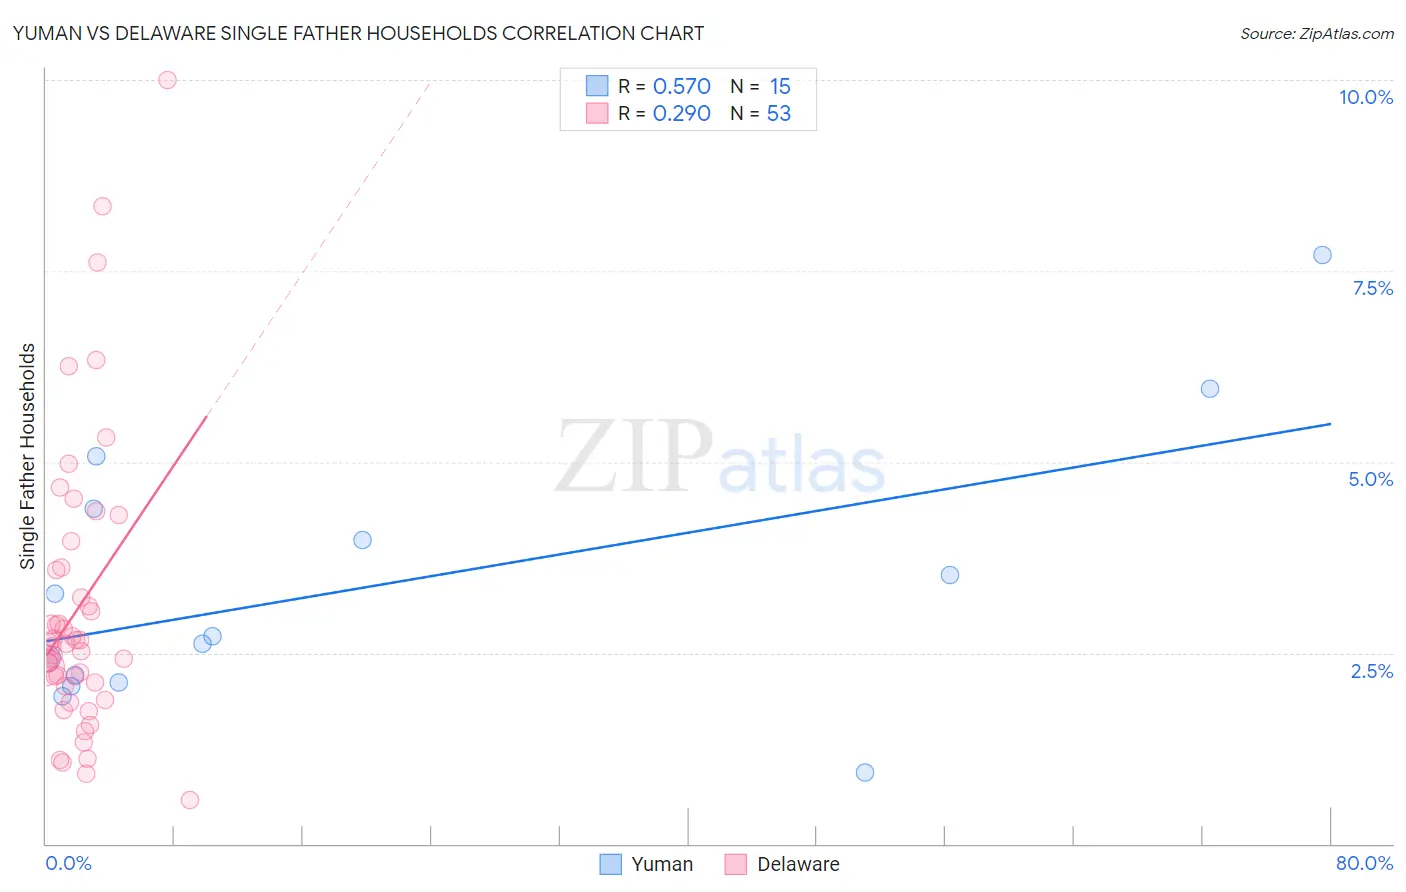
Yuman vs Delaware Single Father Households Correlation Chart
The statistical analysis conducted on geographies consisting of 40,610,556 people shows a substantial positive correlation between the proportion of Yuman and percentage of single father households in the United States with a correlation coefficient (R) of 0.570 and weighted average of 3.3%. Similarly, the statistical analysis conducted on geographies consisting of 95,939,857 people shows a weak positive correlation between the proportion of Delaware and percentage of single father households in the United States with a correlation coefficient (R) of 0.290 and weighted average of 2.5%, a difference of 32.0%.
Single Father Households Correlation Summary
| Measurement | Yuman | Delaware |
| Minimum | 0.94% | 0.57% |
| Maximum | 7.7% | 10.0% |
| Range | 6.8% | 9.4% |
| Mean | 3.4% | 3.1% |
| Median | 2.7% | 2.6% |
| Interquartile 25% (IQ1) | 2.1% | 2.1% |
| Interquartile 75% (IQ3) | 4.4% | 3.6% |
| Interquartile Range (IQR) | 2.3% | 1.5% |
| Standard Deviation (Sample) | 1.8% | 1.9% |
| Standard Deviation (Population) | 1.7% | 1.9% |
Similar Demographics by Single Father Households
Demographics Similar to Yuman by Single Father Households
In terms of single father households, the demographic groups most similar to Yuman are Colville (3.3%, a difference of 0.020%), Paiute (3.3%, a difference of 0.050%), Pueblo (3.3%, a difference of 0.30%), Sioux (3.3%, a difference of 0.98%), and Alaskan Athabascan (3.4%, a difference of 2.5%).
| Demographics | Rating | Rank | Single Father Households |
| Bangladeshis | 0.0 /100 | #327 | Tragic 3.1% |
| Immigrants | Cabo Verde | 0.0 /100 | #328 | Tragic 3.1% |
| Chippewa | 0.0 /100 | #329 | Tragic 3.1% |
| Nepalese | 0.0 /100 | #330 | Tragic 3.1% |
| Navajo | 0.0 /100 | #331 | Tragic 3.2% |
| Yaqui | 0.0 /100 | #332 | Tragic 3.2% |
| Natives/Alaskans | 0.0 /100 | #333 | Tragic 3.2% |
| Yuman | 0.0 /100 | #334 | Tragic 3.3% |
| Colville | 0.0 /100 | #335 | Tragic 3.3% |
| Paiute | 0.0 /100 | #336 | Tragic 3.3% |
| Pueblo | 0.0 /100 | #337 | Tragic 3.3% |
| Sioux | 0.0 /100 | #338 | Tragic 3.3% |
| Alaskan Athabascans | 0.0 /100 | #339 | Tragic 3.4% |
| Alaska Natives | 0.0 /100 | #340 | Tragic 3.5% |
| Crow | 0.0 /100 | #341 | Tragic 3.5% |
Demographics Similar to Delaware by Single Father Households
In terms of single father households, the demographic groups most similar to Delaware are Native Hawaiian (2.5%, a difference of 0.020%), Basque (2.5%, a difference of 0.030%), Bahamian (2.5%, a difference of 0.040%), Immigrants from Cameroon (2.5%, a difference of 0.13%), and Immigrants from Middle Africa (2.5%, a difference of 0.24%).
| Demographics | Rating | Rank | Single Father Households |
| Immigrants | Dominica | 4.8 /100 | #240 | Tragic 2.5% |
| Portuguese | 4.1 /100 | #241 | Tragic 2.5% |
| Osage | 4.1 /100 | #242 | Tragic 2.5% |
| Spaniards | 3.1 /100 | #243 | Tragic 2.5% |
| Immigrants | Middle Africa | 2.8 /100 | #244 | Tragic 2.5% |
| Basques | 2.5 /100 | #245 | Tragic 2.5% |
| Native Hawaiians | 2.5 /100 | #246 | Tragic 2.5% |
| Delaware | 2.5 /100 | #247 | Tragic 2.5% |
| Bahamians | 2.4 /100 | #248 | Tragic 2.5% |
| Immigrants | Cameroon | 2.3 /100 | #249 | Tragic 2.5% |
| Somalis | 2.1 /100 | #250 | Tragic 2.5% |
| Liberians | 2.0 /100 | #251 | Tragic 2.5% |
| Immigrants | Eritrea | 2.0 /100 | #252 | Tragic 2.5% |
| Immigrants | Somalia | 1.9 /100 | #253 | Tragic 2.5% |
| Immigrants | Thailand | 1.8 /100 | #254 | Tragic 2.5% |