Guyanese vs Ute Single Father Households
COMPARE
Guyanese
Ute
Single Father Households
Single Father Households Comparison
Guyanese
Ute
2.1%
SINGLE FATHER HOUSEHOLDS
99.1/ 100
METRIC RATING
98th/ 347
METRIC RANK
3.0%
SINGLE FATHER HOUSEHOLDS
0.0/ 100
METRIC RATING
319th/ 347
METRIC RANK
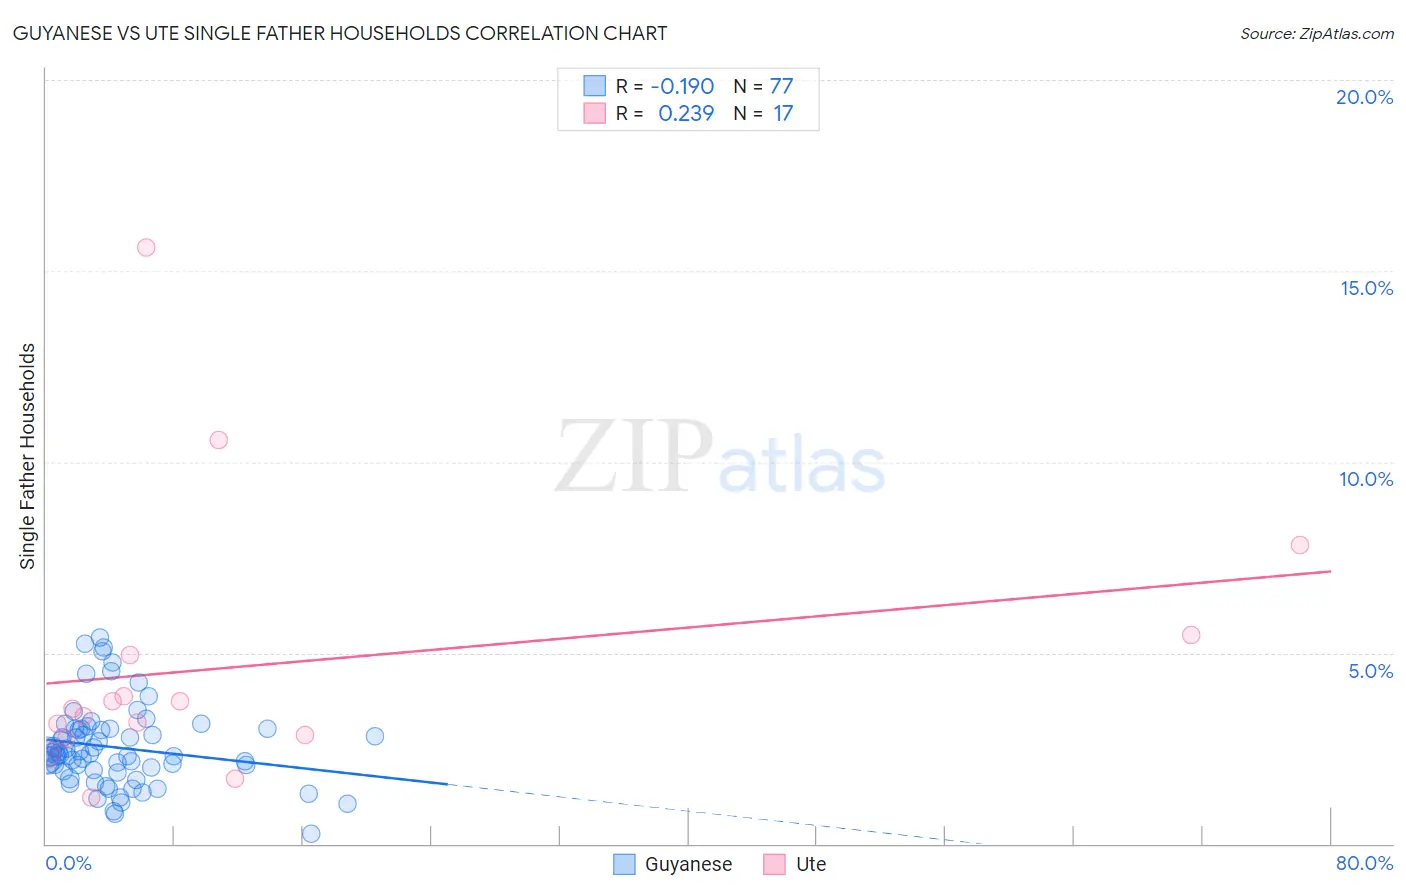
Guyanese vs Ute Single Father Households Correlation Chart
The statistical analysis conducted on geographies consisting of 176,087,716 people shows a poor negative correlation between the proportion of Guyanese and percentage of single father households in the United States with a correlation coefficient (R) of -0.190 and weighted average of 2.1%. Similarly, the statistical analysis conducted on geographies consisting of 55,604,261 people shows a weak positive correlation between the proportion of Ute and percentage of single father households in the United States with a correlation coefficient (R) of 0.239 and weighted average of 3.0%, a difference of 38.6%.
Single Father Households Correlation Summary
| Measurement | Guyanese | Ute |
| Minimum | 0.28% | 1.2% |
| Maximum | 5.4% | 15.6% |
| Range | 5.1% | 14.4% |
| Mean | 2.5% | 4.7% |
| Median | 2.3% | 3.5% |
| Interquartile 25% (IQ1) | 1.9% | 2.8% |
| Interquartile 75% (IQ3) | 3.0% | 5.2% |
| Interquartile Range (IQR) | 1.1% | 2.4% |
| Standard Deviation (Sample) | 1.1% | 3.6% |
| Standard Deviation (Population) | 1.0% | 3.5% |
Similar Demographics by Single Father Households
Demographics Similar to Guyanese by Single Father Households
In terms of single father households, the demographic groups most similar to Guyanese are South African (2.1%, a difference of 0.040%), Immigrants from Moldova (2.1%, a difference of 0.13%), Immigrants from Northern Africa (2.1%, a difference of 0.19%), Arab (2.1%, a difference of 0.25%), and Immigrants from Western Europe (2.1%, a difference of 0.34%).
| Demographics | Rating | Rank | Single Father Households |
| Immigrants | Guyana | 99.4 /100 | #91 | Exceptional 2.1% |
| Romanians | 99.4 /100 | #92 | Exceptional 2.1% |
| Croatians | 99.3 /100 | #93 | Exceptional 2.1% |
| Ukrainians | 99.3 /100 | #94 | Exceptional 2.1% |
| Bermudans | 99.2 /100 | #95 | Exceptional 2.1% |
| Arabs | 99.2 /100 | #96 | Exceptional 2.1% |
| Immigrants | Moldova | 99.1 /100 | #97 | Exceptional 2.1% |
| Guyanese | 99.1 /100 | #98 | Exceptional 2.1% |
| South Africans | 99.1 /100 | #99 | Exceptional 2.1% |
| Immigrants | Northern Africa | 99.0 /100 | #100 | Exceptional 2.1% |
| Immigrants | Western Europe | 98.9 /100 | #101 | Exceptional 2.1% |
| Argentineans | 98.9 /100 | #102 | Exceptional 2.1% |
| Lebanese | 98.9 /100 | #103 | Exceptional 2.1% |
| Alsatians | 98.9 /100 | #104 | Exceptional 2.1% |
| Palestinians | 98.6 /100 | #105 | Exceptional 2.2% |
Demographics Similar to Ute by Single Father Households
In terms of single father households, the demographic groups most similar to Ute are Guatemalan (3.0%, a difference of 0.080%), Mexican (3.0%, a difference of 0.47%), Cape Verdean (2.9%, a difference of 0.53%), Immigrants from El Salvador (2.9%, a difference of 0.54%), and Immigrants from Guatemala (3.0%, a difference of 1.0%).
| Demographics | Rating | Rank | Single Father Households |
| Tsimshian | 0.0 /100 | #312 | Tragic 2.9% |
| Arapaho | 0.0 /100 | #313 | Tragic 2.9% |
| Salvadorans | 0.0 /100 | #314 | Tragic 2.9% |
| Cheyenne | 0.0 /100 | #315 | Tragic 2.9% |
| Houma | 0.0 /100 | #316 | Tragic 2.9% |
| Immigrants | El Salvador | 0.0 /100 | #317 | Tragic 2.9% |
| Cape Verdeans | 0.0 /100 | #318 | Tragic 2.9% |
| Ute | 0.0 /100 | #319 | Tragic 3.0% |
| Guatemalans | 0.0 /100 | #320 | Tragic 3.0% |
| Mexicans | 0.0 /100 | #321 | Tragic 3.0% |
| Immigrants | Guatemala | 0.0 /100 | #322 | Tragic 3.0% |
| Immigrants | Central America | 0.0 /100 | #323 | Tragic 3.0% |
| Fijians | 0.0 /100 | #324 | Tragic 3.0% |
| Immigrants | Mexico | 0.0 /100 | #325 | Tragic 3.0% |
| Aleuts | 0.0 /100 | #326 | Tragic 3.0% |