Yuman vs Ute Unemployment Among Youth under 25 years
COMPARE
Yuman
Ute
Unemployment Among Youth under 25 years
Unemployment Among Youth under 25 years Comparison
Yuman
Ute
16.3%
UNEMPLOYMENT AMONG YOUTH UNDER 25 YEARS
0.0/ 100
METRIC RATING
338th/ 347
METRIC RANK
13.3%
UNEMPLOYMENT AMONG YOUTH UNDER 25 YEARS
0.0/ 100
METRIC RATING
280th/ 347
METRIC RANK
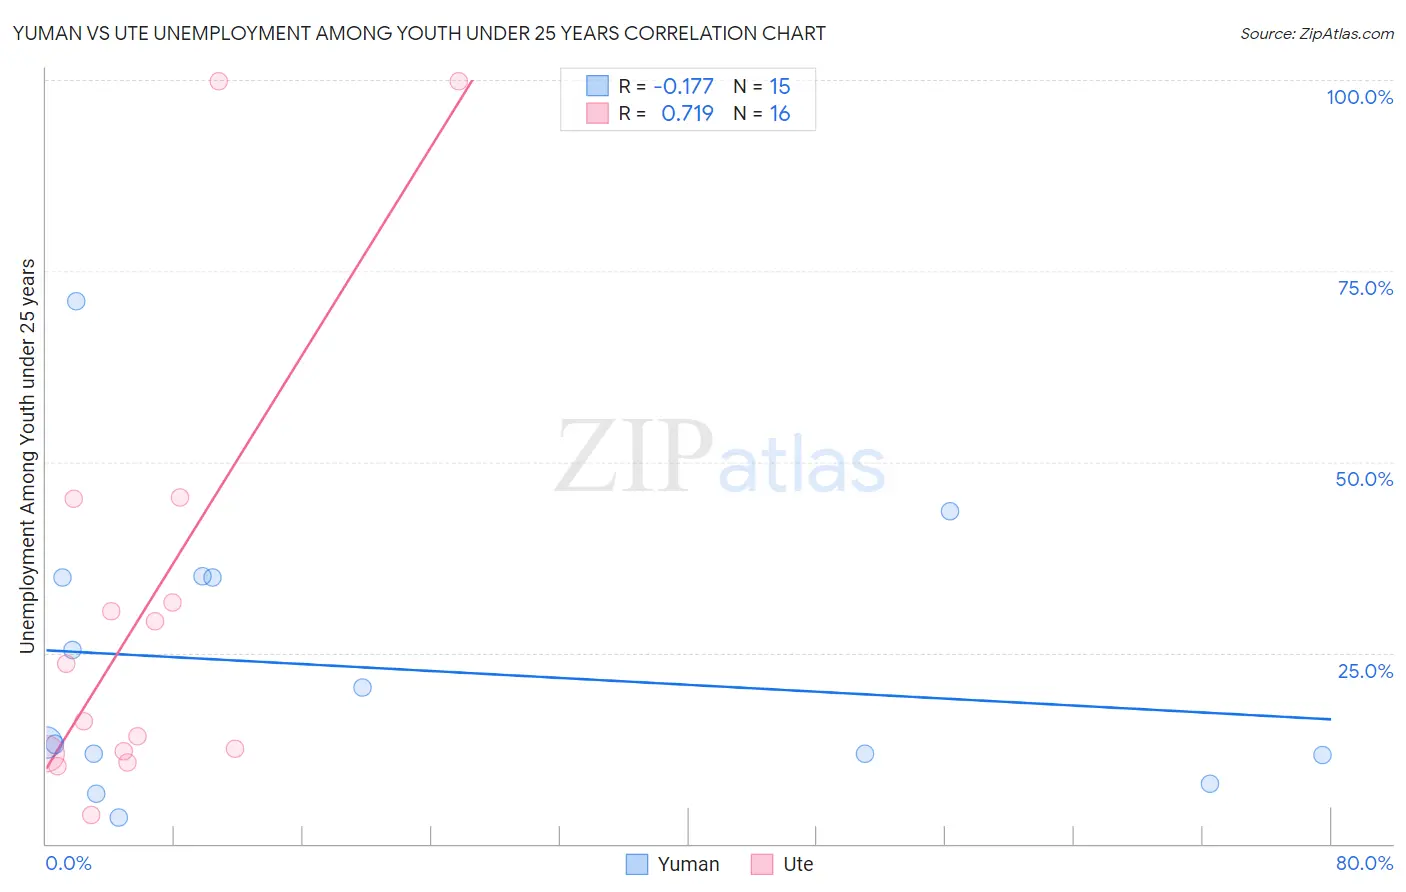
Yuman vs Ute Unemployment Among Youth under 25 years Correlation Chart
The statistical analysis conducted on geographies consisting of 40,598,494 people shows a poor negative correlation between the proportion of Yuman and unemployment rate among youth under the age of 25 in the United States with a correlation coefficient (R) of -0.177 and weighted average of 16.3%. Similarly, the statistical analysis conducted on geographies consisting of 55,521,098 people shows a strong positive correlation between the proportion of Ute and unemployment rate among youth under the age of 25 in the United States with a correlation coefficient (R) of 0.719 and weighted average of 13.3%, a difference of 22.9%.
Unemployment Among Youth under 25 years Correlation Summary
| Measurement | Yuman | Ute |
| Minimum | 3.5% | 3.8% |
| Maximum | 71.0% | 99.9% |
| Range | 67.5% | 96.1% |
| Mean | 23.0% | 31.0% |
| Median | 13.2% | 19.9% |
| Interquartile 25% (IQ1) | 11.6% | 11.9% |
| Interquartile 75% (IQ3) | 34.9% | 38.4% |
| Interquartile Range (IQR) | 23.3% | 26.5% |
| Standard Deviation (Sample) | 18.2% | 29.6% |
| Standard Deviation (Population) | 17.6% | 28.7% |
Similar Demographics by Unemployment Among Youth under 25 years
Demographics Similar to Yuman by Unemployment Among Youth under 25 years
In terms of unemployment among youth under 25 years, the demographic groups most similar to Yuman are Arapaho (16.3%, a difference of 0.30%), Pima (16.2%, a difference of 0.45%), Tsimshian (16.5%, a difference of 1.0%), Immigrants from St. Vincent and the Grenadines (16.1%, a difference of 1.1%), and Immigrants from Guyana (15.9%, a difference of 2.4%).
| Demographics | Rating | Rank | Unemployment Among Youth under 25 years |
| Dominicans | 0.0 /100 | #331 | Tragic 15.7% |
| Immigrants | Grenada | 0.0 /100 | #332 | Tragic 15.8% |
| Guyanese | 0.0 /100 | #333 | Tragic 15.9% |
| Immigrants | Guyana | 0.0 /100 | #334 | Tragic 15.9% |
| Immigrants | St. Vincent and the Grenadines | 0.0 /100 | #335 | Tragic 16.1% |
| Pima | 0.0 /100 | #336 | Tragic 16.2% |
| Arapaho | 0.0 /100 | #337 | Tragic 16.3% |
| Yuman | 0.0 /100 | #338 | Tragic 16.3% |
| Tsimshian | 0.0 /100 | #339 | Tragic 16.5% |
| Colville | 0.0 /100 | #340 | Tragic 16.8% |
| Paiute | 0.0 /100 | #341 | Tragic 17.6% |
| Puerto Ricans | 0.0 /100 | #342 | Tragic 18.4% |
| Navajo | 0.0 /100 | #343 | Tragic 18.6% |
| Crow | 0.0 /100 | #344 | Tragic 20.1% |
| Hopi | 0.0 /100 | #345 | Tragic 21.5% |
Demographics Similar to Ute by Unemployment Among Youth under 25 years
In terms of unemployment among youth under 25 years, the demographic groups most similar to Ute are Armenian (13.3%, a difference of 0.030%), Sierra Leonean (13.3%, a difference of 0.040%), Immigrants from Cameroon (13.3%, a difference of 0.060%), Lumbee (13.3%, a difference of 0.080%), and Ghanaian (13.3%, a difference of 0.16%).
| Demographics | Rating | Rank | Unemployment Among Youth under 25 years |
| Nigerians | 0.0 /100 | #273 | Tragic 13.0% |
| Immigrants | Nigeria | 0.0 /100 | #274 | Tragic 13.0% |
| Bermudans | 0.0 /100 | #275 | Tragic 13.0% |
| Immigrants | Uzbekistan | 0.0 /100 | #276 | Tragic 13.1% |
| Bahamians | 0.0 /100 | #277 | Tragic 13.1% |
| Africans | 0.0 /100 | #278 | Tragic 13.2% |
| Cajuns | 0.0 /100 | #279 | Tragic 13.2% |
| Ute | 0.0 /100 | #280 | Tragic 13.3% |
| Armenians | 0.0 /100 | #281 | Tragic 13.3% |
| Sierra Leoneans | 0.0 /100 | #282 | Tragic 13.3% |
| Immigrants | Cameroon | 0.0 /100 | #283 | Tragic 13.3% |
| Lumbee | 0.0 /100 | #284 | Tragic 13.3% |
| Ghanaians | 0.0 /100 | #285 | Tragic 13.3% |
| Blackfeet | 0.0 /100 | #286 | Tragic 13.3% |
| Ecuadorians | 0.0 /100 | #287 | Tragic 13.3% |