Yuman vs Immigrants from Laos Single Mother Households
COMPARE
Yuman
Immigrants from Laos
Single Mother Households
Single Mother Households Comparison
Yuman
Immigrants from Laos
9.6%
SINGLE MOTHER HOUSEHOLDS
0.0/ 100
METRIC RATING
346th/ 347
METRIC RANK
7.7%
SINGLE MOTHER HOUSEHOLDS
0.0/ 100
METRIC RATING
281st/ 347
METRIC RANK
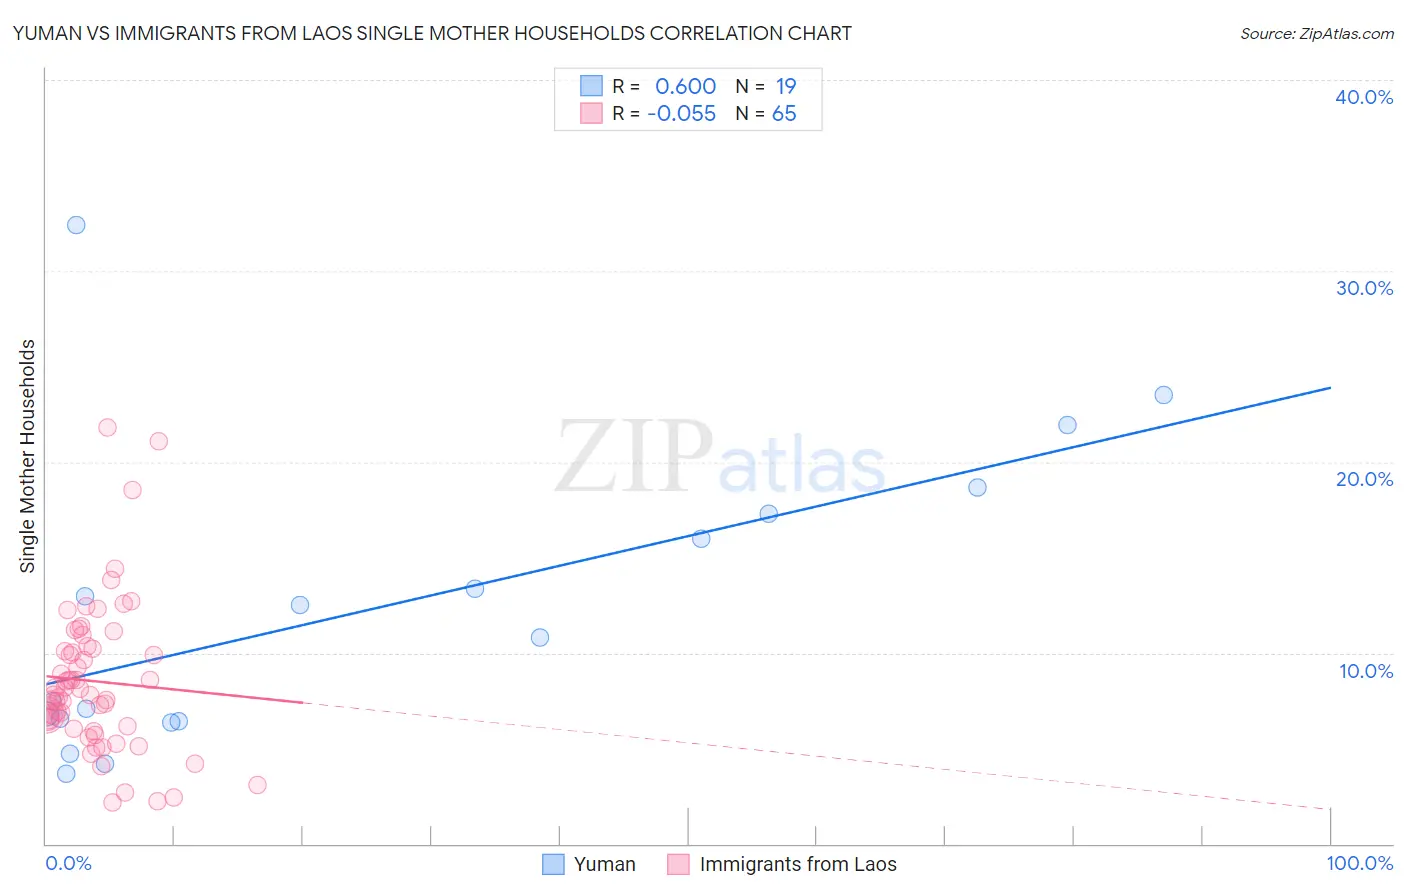
Yuman vs Immigrants from Laos Single Mother Households Correlation Chart
The statistical analysis conducted on geographies consisting of 40,651,175 people shows a significant positive correlation between the proportion of Yuman and percentage of single mother households in the United States with a correlation coefficient (R) of 0.600 and weighted average of 9.6%. Similarly, the statistical analysis conducted on geographies consisting of 201,339,065 people shows a slight negative correlation between the proportion of Immigrants from Laos and percentage of single mother households in the United States with a correlation coefficient (R) of -0.055 and weighted average of 7.7%, a difference of 25.7%.
Single Mother Households Correlation Summary
| Measurement | Yuman | Immigrants from Laos |
| Minimum | 3.7% | 2.2% |
| Maximum | 32.4% | 21.8% |
| Range | 28.7% | 19.6% |
| Mean | 12.2% | 8.5% |
| Median | 10.8% | 7.8% |
| Interquartile 25% (IQ1) | 6.4% | 6.1% |
| Interquartile 75% (IQ3) | 17.3% | 10.3% |
| Interquartile Range (IQR) | 10.8% | 4.2% |
| Standard Deviation (Sample) | 7.8% | 3.9% |
| Standard Deviation (Population) | 7.6% | 3.9% |
Similar Demographics by Single Mother Households
Demographics Similar to Yuman by Single Mother Households
In terms of single mother households, the demographic groups most similar to Yuman are Immigrants from Cabo Verde (9.6%, a difference of 0.59%), Immigrants from Dominican Republic (9.5%, a difference of 1.4%), Yup'ik (10.0%, a difference of 3.8%), Dominican (9.2%, a difference of 4.9%), and Menominee (9.2%, a difference of 5.2%).
| Demographics | Rating | Rank | Single Mother Households |
| Liberians | 0.0 /100 | #333 | Tragic 8.6% |
| Immigrants | Liberia | 0.0 /100 | #334 | Tragic 8.7% |
| Immigrants | Dominica | 0.0 /100 | #335 | Tragic 8.7% |
| Puerto Ricans | 0.0 /100 | #336 | Tragic 8.7% |
| Navajo | 0.0 /100 | #337 | Tragic 8.8% |
| Cape Verdeans | 0.0 /100 | #338 | Tragic 8.9% |
| Blacks/African Americans | 0.0 /100 | #339 | Tragic 9.0% |
| Lumbee | 0.0 /100 | #340 | Tragic 9.1% |
| Tohono O'odham | 0.0 /100 | #341 | Tragic 9.1% |
| Menominee | 0.0 /100 | #342 | Tragic 9.2% |
| Dominicans | 0.0 /100 | #343 | Tragic 9.2% |
| Immigrants | Dominican Republic | 0.0 /100 | #344 | Tragic 9.5% |
| Immigrants | Cabo Verde | 0.0 /100 | #345 | Tragic 9.6% |
| Yuman | 0.0 /100 | #346 | Tragic 9.6% |
| Yup'ik | 0.0 /100 | #347 | Tragic 10.0% |
Demographics Similar to Immigrants from Laos by Single Mother Households
In terms of single mother households, the demographic groups most similar to Immigrants from Laos are Immigrants from Sierra Leone (7.7%, a difference of 0.0%), Guatemalan (7.7%, a difference of 0.020%), Nigerian (7.7%, a difference of 0.050%), Immigrants from El Salvador (7.6%, a difference of 0.52%), and Immigrants from Belize (7.7%, a difference of 0.65%).
| Demographics | Rating | Rank | Single Mother Households |
| Immigrants | Guyana | 0.1 /100 | #274 | Tragic 7.6% |
| Central American Indians | 0.1 /100 | #275 | Tragic 7.6% |
| Guyanese | 0.1 /100 | #276 | Tragic 7.6% |
| Immigrants | Trinidad and Tobago | 0.1 /100 | #277 | Tragic 7.6% |
| Central Americans | 0.1 /100 | #278 | Tragic 7.6% |
| Immigrants | El Salvador | 0.0 /100 | #279 | Tragic 7.6% |
| Immigrants | Sierra Leone | 0.0 /100 | #280 | Tragic 7.7% |
| Immigrants | Laos | 0.0 /100 | #281 | Tragic 7.7% |
| Guatemalans | 0.0 /100 | #282 | Tragic 7.7% |
| Nigerians | 0.0 /100 | #283 | Tragic 7.7% |
| Immigrants | Belize | 0.0 /100 | #284 | Tragic 7.7% |
| Trinidadians and Tobagonians | 0.0 /100 | #285 | Tragic 7.7% |
| Immigrants | Middle Africa | 0.0 /100 | #286 | Tragic 7.7% |
| Immigrants | Guatemala | 0.0 /100 | #287 | Tragic 7.7% |
| Sierra Leoneans | 0.0 /100 | #288 | Tragic 7.7% |