Yuman vs Immigrants from Sri Lanka Single Mother Households
COMPARE
Yuman
Immigrants from Sri Lanka
Single Mother Households
Single Mother Households Comparison
Yuman
Immigrants from Sri Lanka
9.6%
SINGLE MOTHER HOUSEHOLDS
0.0/ 100
METRIC RATING
346th/ 347
METRIC RANK
5.6%
SINGLE MOTHER HOUSEHOLDS
98.0/ 100
METRIC RATING
79th/ 347
METRIC RANK
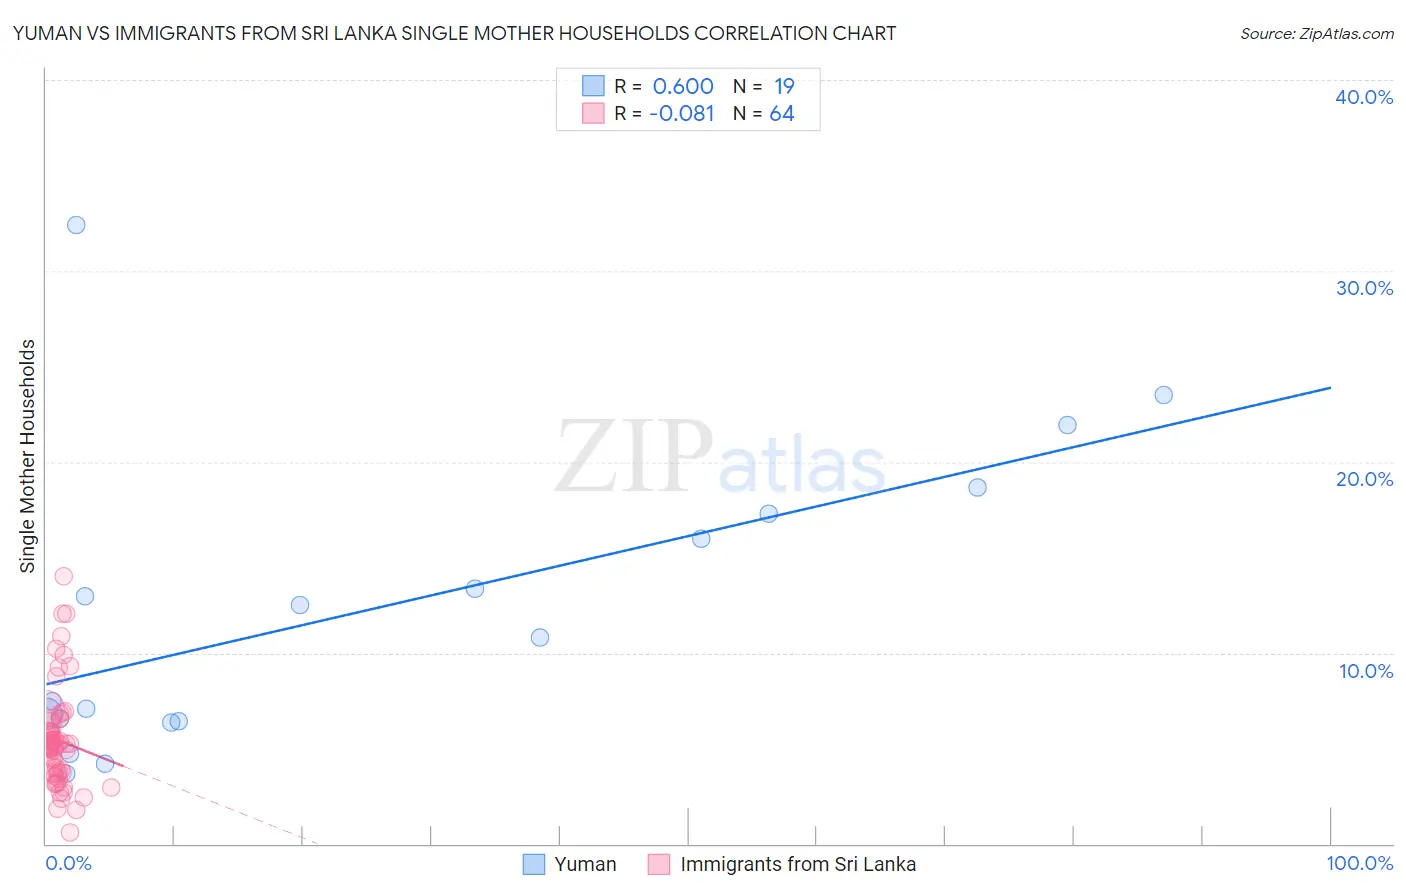
Yuman vs Immigrants from Sri Lanka Single Mother Households Correlation Chart
The statistical analysis conducted on geographies consisting of 40,651,175 people shows a significant positive correlation between the proportion of Yuman and percentage of single mother households in the United States with a correlation coefficient (R) of 0.600 and weighted average of 9.6%. Similarly, the statistical analysis conducted on geographies consisting of 149,613,913 people shows a slight negative correlation between the proportion of Immigrants from Sri Lanka and percentage of single mother households in the United States with a correlation coefficient (R) of -0.081 and weighted average of 5.6%, a difference of 70.8%.
Single Mother Households Correlation Summary
| Measurement | Yuman | Immigrants from Sri Lanka |
| Minimum | 3.7% | 0.60% |
| Maximum | 32.4% | 14.0% |
| Range | 28.7% | 13.4% |
| Mean | 12.2% | 5.4% |
| Median | 10.8% | 5.1% |
| Interquartile 25% (IQ1) | 6.4% | 3.7% |
| Interquartile 75% (IQ3) | 17.3% | 6.1% |
| Interquartile Range (IQR) | 10.8% | 2.4% |
| Standard Deviation (Sample) | 7.8% | 2.6% |
| Standard Deviation (Population) | 7.6% | 2.6% |
Similar Demographics by Single Mother Households
Demographics Similar to Yuman by Single Mother Households
In terms of single mother households, the demographic groups most similar to Yuman are Immigrants from Cabo Verde (9.6%, a difference of 0.59%), Immigrants from Dominican Republic (9.5%, a difference of 1.4%), Yup'ik (10.0%, a difference of 3.8%), Dominican (9.2%, a difference of 4.9%), and Menominee (9.2%, a difference of 5.2%).
| Demographics | Rating | Rank | Single Mother Households |
| Liberians | 0.0 /100 | #333 | Tragic 8.6% |
| Immigrants | Liberia | 0.0 /100 | #334 | Tragic 8.7% |
| Immigrants | Dominica | 0.0 /100 | #335 | Tragic 8.7% |
| Puerto Ricans | 0.0 /100 | #336 | Tragic 8.7% |
| Navajo | 0.0 /100 | #337 | Tragic 8.8% |
| Cape Verdeans | 0.0 /100 | #338 | Tragic 8.9% |
| Blacks/African Americans | 0.0 /100 | #339 | Tragic 9.0% |
| Lumbee | 0.0 /100 | #340 | Tragic 9.1% |
| Tohono O'odham | 0.0 /100 | #341 | Tragic 9.1% |
| Menominee | 0.0 /100 | #342 | Tragic 9.2% |
| Dominicans | 0.0 /100 | #343 | Tragic 9.2% |
| Immigrants | Dominican Republic | 0.0 /100 | #344 | Tragic 9.5% |
| Immigrants | Cabo Verde | 0.0 /100 | #345 | Tragic 9.6% |
| Yuman | 0.0 /100 | #346 | Tragic 9.6% |
| Yup'ik | 0.0 /100 | #347 | Tragic 10.0% |
Demographics Similar to Immigrants from Sri Lanka by Single Mother Households
In terms of single mother households, the demographic groups most similar to Immigrants from Sri Lanka are Czech (5.6%, a difference of 0.11%), Immigrants from Moldova (5.6%, a difference of 0.11%), Swiss (5.6%, a difference of 0.20%), Romanian (5.6%, a difference of 0.21%), and Immigrants from Malaysia (5.7%, a difference of 0.32%).
| Demographics | Rating | Rank | Single Mother Households |
| Immigrants | Netherlands | 98.4 /100 | #72 | Exceptional 5.6% |
| Immigrants | Asia | 98.4 /100 | #73 | Exceptional 5.6% |
| Immigrants | North America | 98.3 /100 | #74 | Exceptional 5.6% |
| Slovenes | 98.3 /100 | #75 | Exceptional 5.6% |
| New Zealanders | 98.2 /100 | #76 | Exceptional 5.6% |
| Romanians | 98.1 /100 | #77 | Exceptional 5.6% |
| Swiss | 98.1 /100 | #78 | Exceptional 5.6% |
| Immigrants | Sri Lanka | 98.0 /100 | #79 | Exceptional 5.6% |
| Czechs | 97.9 /100 | #80 | Exceptional 5.6% |
| Immigrants | Moldova | 97.9 /100 | #81 | Exceptional 5.6% |
| Immigrants | Malaysia | 97.8 /100 | #82 | Exceptional 5.7% |
| Immigrants | Hungary | 97.8 /100 | #83 | Exceptional 5.7% |
| Carpatho Rusyns | 97.7 /100 | #84 | Exceptional 5.7% |
| Hungarians | 97.6 /100 | #85 | Exceptional 5.7% |
| Finns | 97.6 /100 | #86 | Exceptional 5.7% |