Immigrants from Ghana vs Immigrants from Bolivia Single Father Households
COMPARE
Immigrants from Ghana
Immigrants from Bolivia
Single Father Households
Single Father Households Comparison
Immigrants from Ghana
Immigrants from Bolivia
2.4%
SINGLE FATHER HOUSEHOLDS
9.1/ 100
METRIC RATING
228th/ 347
METRIC RANK
2.3%
SINGLE FATHER HOUSEHOLDS
76.3/ 100
METRIC RATING
160th/ 347
METRIC RANK
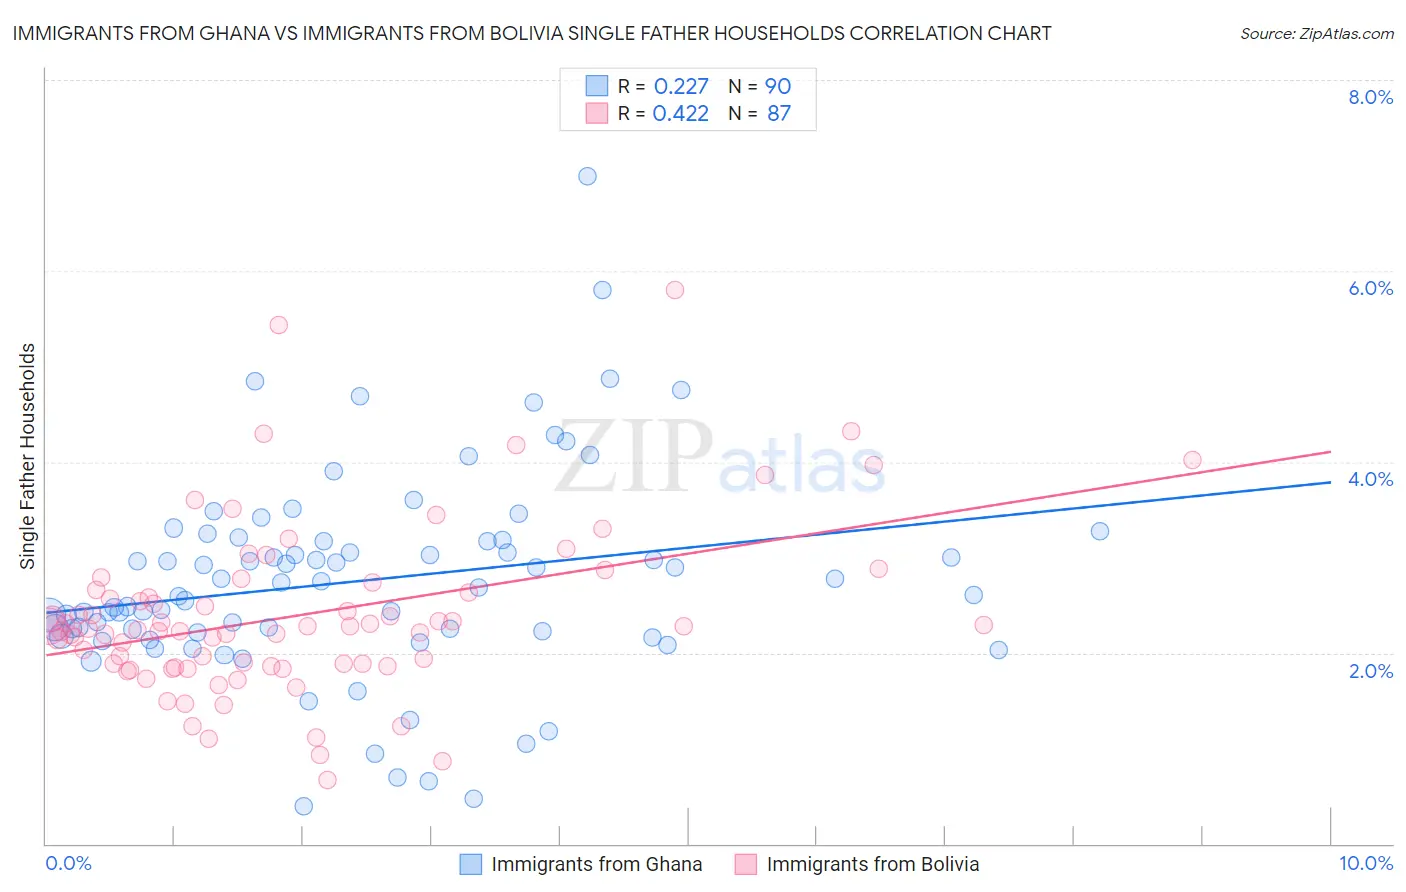
Immigrants from Ghana vs Immigrants from Bolivia Single Father Households Correlation Chart
The statistical analysis conducted on geographies consisting of 199,188,278 people shows a weak positive correlation between the proportion of Immigrants from Ghana and percentage of single father households in the United States with a correlation coefficient (R) of 0.227 and weighted average of 2.4%. Similarly, the statistical analysis conducted on geographies consisting of 158,280,287 people shows a moderate positive correlation between the proportion of Immigrants from Bolivia and percentage of single father households in the United States with a correlation coefficient (R) of 0.422 and weighted average of 2.3%, a difference of 6.5%.
Single Father Households Correlation Summary
| Measurement | Immigrants from Ghana | Immigrants from Bolivia |
| Minimum | 0.39% | 0.67% |
| Maximum | 7.0% | 5.8% |
| Range | 6.6% | 5.1% |
| Mean | 2.8% | 2.4% |
| Median | 2.6% | 2.3% |
| Interquartile 25% (IQ1) | 2.2% | 1.9% |
| Interquartile 75% (IQ3) | 3.2% | 2.7% |
| Interquartile Range (IQR) | 0.96% | 0.80% |
| Standard Deviation (Sample) | 1.1% | 0.90% |
| Standard Deviation (Population) | 1.1% | 0.89% |
Similar Demographics by Single Father Households
Demographics Similar to Immigrants from Ghana by Single Father Households
In terms of single father households, the demographic groups most similar to Immigrants from Ghana are American (2.4%, a difference of 0.040%), Black/African American (2.4%, a difference of 0.11%), Immigrants from Zaire (2.4%, a difference of 0.11%), Marshallese (2.4%, a difference of 0.12%), and Subsaharan African (2.4%, a difference of 0.20%).
| Demographics | Rating | Rank | Single Father Households |
| Immigrants | Burma/Myanmar | 12.1 /100 | #221 | Poor 2.4% |
| Immigrants | Eastern Africa | 11.9 /100 | #222 | Poor 2.4% |
| Immigrants | Uruguay | 11.0 /100 | #223 | Poor 2.4% |
| Immigrants | Bahamas | 10.6 /100 | #224 | Poor 2.4% |
| Marshallese | 9.7 /100 | #225 | Tragic 2.4% |
| Blacks/African Americans | 9.7 /100 | #226 | Tragic 2.4% |
| Americans | 9.3 /100 | #227 | Tragic 2.4% |
| Immigrants | Ghana | 9.1 /100 | #228 | Tragic 2.4% |
| Immigrants | Zaire | 8.6 /100 | #229 | Tragic 2.4% |
| Sub-Saharan Africans | 8.3 /100 | #230 | Tragic 2.4% |
| Immigrants | Nonimmigrants | 7.6 /100 | #231 | Tragic 2.4% |
| Pennsylvania Germans | 7.3 /100 | #232 | Tragic 2.4% |
| Immigrants | Western Africa | 7.0 /100 | #233 | Tragic 2.4% |
| Africans | 6.3 /100 | #234 | Tragic 2.5% |
| Immigrants | Immigrants | 6.3 /100 | #235 | Tragic 2.5% |
Demographics Similar to Immigrants from Bolivia by Single Father Households
In terms of single father households, the demographic groups most similar to Immigrants from Bolivia are Immigrants from West Indies (2.3%, a difference of 0.18%), Swiss (2.3%, a difference of 0.30%), Scottish (2.3%, a difference of 0.34%), Immigrants from Senegal (2.3%, a difference of 0.35%), and Canadian (2.3%, a difference of 0.38%).
| Demographics | Rating | Rank | Single Father Households |
| Immigrants | Germany | 82.8 /100 | #153 | Excellent 2.3% |
| Bolivians | 81.0 /100 | #154 | Excellent 2.3% |
| Europeans | 80.9 /100 | #155 | Excellent 2.3% |
| Immigrants | South America | 79.9 /100 | #156 | Good 2.3% |
| Canadians | 79.7 /100 | #157 | Good 2.3% |
| Immigrants | Senegal | 79.4 /100 | #158 | Good 2.3% |
| Immigrants | West Indies | 77.9 /100 | #159 | Good 2.3% |
| Immigrants | Bolivia | 76.3 /100 | #160 | Good 2.3% |
| Swiss | 73.2 /100 | #161 | Good 2.3% |
| Scottish | 72.8 /100 | #162 | Good 2.3% |
| Irish | 72.1 /100 | #163 | Good 2.3% |
| Pakistanis | 70.6 /100 | #164 | Good 2.3% |
| Scotch-Irish | 69.4 /100 | #165 | Good 2.3% |
| English | 68.6 /100 | #166 | Good 2.3% |
| South Americans | 64.3 /100 | #167 | Good 2.3% |