Immigrants from Ethiopia vs Ethiopian Average Family Size
COMPARE
Immigrants from Ethiopia
Ethiopian
Average Family Size
Average Family Size Comparison
Immigrants from Ethiopia
Ethiopians
3.25
AVERAGE FAMILY SIZE
81.6/ 100
METRIC RATING
139th/ 347
METRIC RANK
3.24
AVERAGE FAMILY SIZE
63.9/ 100
METRIC RATING
159th/ 347
METRIC RANK
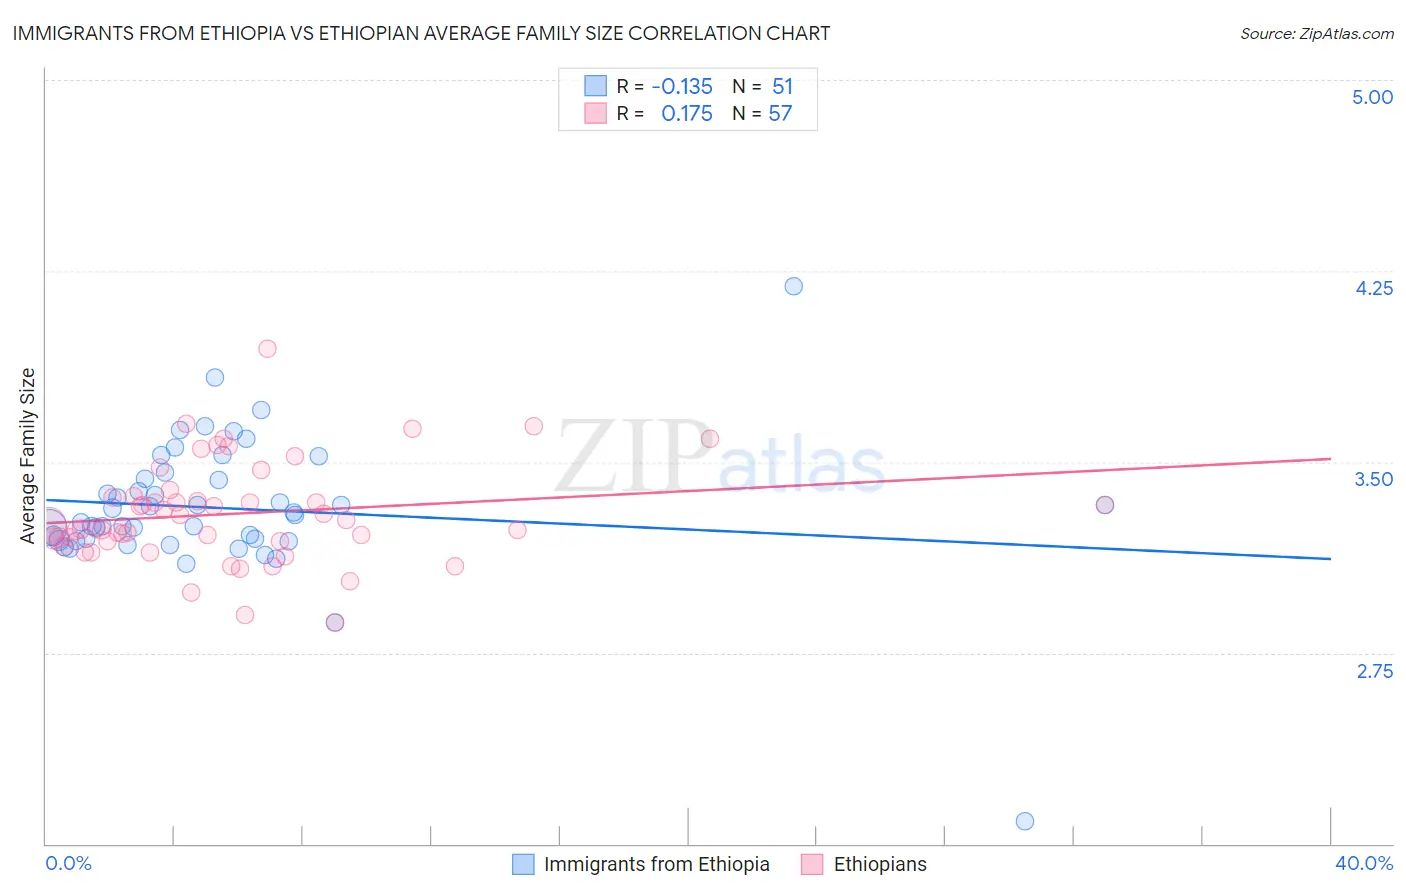
Immigrants from Ethiopia vs Ethiopian Average Family Size Correlation Chart
The statistical analysis conducted on geographies consisting of 211,454,545 people shows a poor negative correlation between the proportion of Immigrants from Ethiopia and average family size in the United States with a correlation coefficient (R) of -0.135 and weighted average of 3.25. Similarly, the statistical analysis conducted on geographies consisting of 223,060,111 people shows a poor positive correlation between the proportion of Ethiopians and average family size in the United States with a correlation coefficient (R) of 0.175 and weighted average of 3.24, a difference of 0.42%.
Average Family Size Correlation Summary
| Measurement | Immigrants from Ethiopia | Ethiopian |
| Minimum | 2.09 | 2.87 |
| Maximum | 4.19 | 3.94 |
| Range | 2.10 | 1.07 |
| Mean | 3.32 | 3.30 |
| Median | 3.29 | 3.25 |
| Interquartile 25% (IQ1) | 3.19 | 3.19 |
| Interquartile 75% (IQ3) | 3.43 | 3.36 |
| Interquartile Range (IQR) | 0.24 | 0.18 |
| Standard Deviation (Sample) | 0.28 | 0.20 |
| Standard Deviation (Population) | 0.28 | 0.20 |
Demographics Similar to Immigrants from Ethiopia and Ethiopians by Average Family Size
In terms of average family size, the demographic groups most similar to Immigrants from Ethiopia are Subsaharan African (3.25, a difference of 0.0%), Venezuelan (3.25, a difference of 0.010%), Liberian (3.25, a difference of 0.010%), Bhutanese (3.25, a difference of 0.020%), and Tsimshian (3.25, a difference of 0.040%). Similarly, the demographic groups most similar to Ethiopians are Iraqi (3.24, a difference of 0.010%), Immigrants from Uzbekistan (3.24, a difference of 0.060%), Immigrants from Taiwan (3.24, a difference of 0.080%), Seminole (3.24, a difference of 0.090%), and Immigrants from Egypt (3.24, a difference of 0.13%).
| Demographics | Rating | Rank | Average Family Size |
| Immigrants | Ethiopia | 81.6 /100 | #139 | Excellent 3.25 |
| Sub-Saharan Africans | 81.6 /100 | #140 | Excellent 3.25 |
| Venezuelans | 81.4 /100 | #141 | Excellent 3.25 |
| Liberians | 81.2 /100 | #142 | Excellent 3.25 |
| Bhutanese | 81.0 /100 | #143 | Excellent 3.25 |
| Tsimshian | 80.2 /100 | #144 | Excellent 3.25 |
| Armenians | 78.2 /100 | #145 | Good 3.25 |
| Immigrants | Africa | 77.9 /100 | #146 | Good 3.25 |
| Immigrants | Jordan | 75.7 /100 | #147 | Good 3.24 |
| Blackfeet | 75.0 /100 | #148 | Good 3.24 |
| Assyrians/Chaldeans/Syriacs | 73.8 /100 | #149 | Good 3.24 |
| Indians (Asian) | 73.6 /100 | #150 | Good 3.24 |
| Jordanians | 73.5 /100 | #151 | Good 3.24 |
| Spanish Americans | 72.5 /100 | #152 | Good 3.24 |
| Immigrants | Eritrea | 71.4 /100 | #153 | Good 3.24 |
| Immigrants | Egypt | 70.0 /100 | #154 | Good 3.24 |
| Seminole | 68.2 /100 | #155 | Good 3.24 |
| Immigrants | Taiwan | 68.1 /100 | #156 | Good 3.24 |
| Immigrants | Uzbekistan | 67.0 /100 | #157 | Good 3.24 |
| Iraqis | 64.3 /100 | #158 | Good 3.24 |
| Ethiopians | 63.9 /100 | #159 | Good 3.24 |