Yugoslavian vs Ethiopian 9th Grade
COMPARE
Yugoslavian
Ethiopian
9th Grade
9th Grade Comparison
Yugoslavians
Ethiopians
95.7%
9TH GRADE
98.9/ 100
METRIC RATING
89th/ 347
METRIC RANK
94.4%
9TH GRADE
5.4/ 100
METRIC RATING
225th/ 347
METRIC RANK
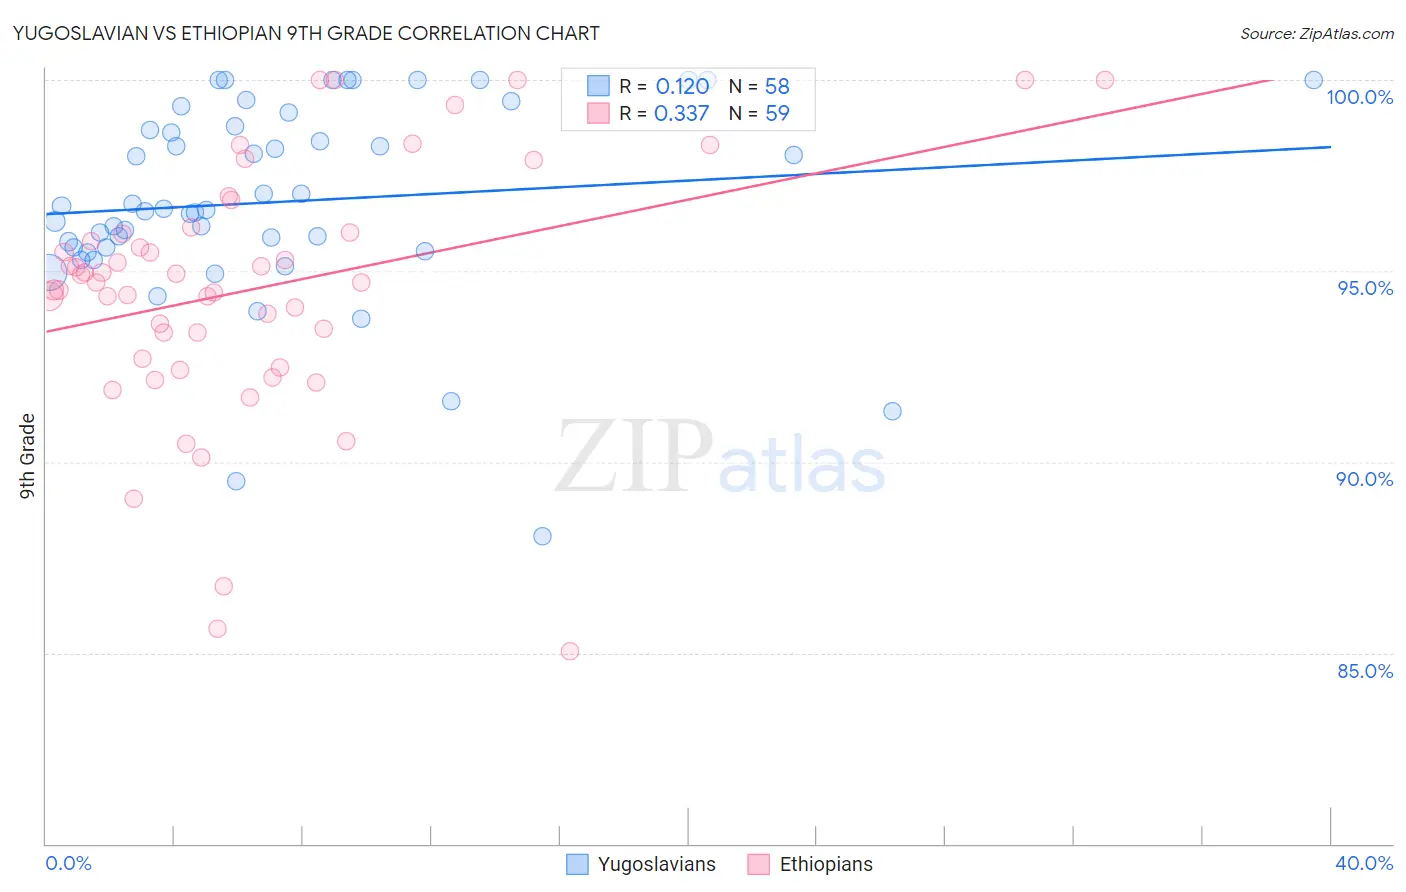
Yugoslavian vs Ethiopian 9th Grade Correlation Chart
The statistical analysis conducted on geographies consisting of 285,683,014 people shows a poor positive correlation between the proportion of Yugoslavians and percentage of population with at least 9th grade education in the United States with a correlation coefficient (R) of 0.120 and weighted average of 95.7%. Similarly, the statistical analysis conducted on geographies consisting of 223,135,094 people shows a mild positive correlation between the proportion of Ethiopians and percentage of population with at least 9th grade education in the United States with a correlation coefficient (R) of 0.337 and weighted average of 94.4%, a difference of 1.3%.
9th Grade Correlation Summary
| Measurement | Yugoslavian | Ethiopian |
| Minimum | 88.0% | 85.0% |
| Maximum | 100.0% | 100.0% |
| Range | 12.0% | 15.0% |
| Mean | 96.8% | 94.5% |
| Median | 96.6% | 94.7% |
| Interquartile 25% (IQ1) | 95.6% | 92.7% |
| Interquartile 75% (IQ3) | 98.8% | 96.0% |
| Interquartile Range (IQR) | 3.2% | 3.3% |
| Standard Deviation (Sample) | 2.6% | 3.3% |
| Standard Deviation (Population) | 2.6% | 3.3% |
Similar Demographics by 9th Grade
Demographics Similar to Yugoslavians by 9th Grade
In terms of 9th grade, the demographic groups most similar to Yugoslavians are Immigrants from Czechoslovakia (95.7%, a difference of 0.0%), South African (95.6%, a difference of 0.010%), Creek (95.6%, a difference of 0.010%), Okinawan (95.7%, a difference of 0.020%), and Immigrants from Saudi Arabia (95.6%, a difference of 0.020%).
| Demographics | Rating | Rank | 9th Grade |
| Puget Sound Salish | 99.2 /100 | #82 | Exceptional 95.7% |
| Swiss | 99.2 /100 | #83 | Exceptional 95.7% |
| Immigrants | Denmark | 99.1 /100 | #84 | Exceptional 95.7% |
| Icelanders | 99.1 /100 | #85 | Exceptional 95.7% |
| Immigrants | Western Europe | 99.1 /100 | #86 | Exceptional 95.7% |
| Okinawans | 99.0 /100 | #87 | Exceptional 95.7% |
| Immigrants | Czechoslovakia | 98.9 /100 | #88 | Exceptional 95.7% |
| Yugoslavians | 98.9 /100 | #89 | Exceptional 95.7% |
| South Africans | 98.8 /100 | #90 | Exceptional 95.6% |
| Creek | 98.8 /100 | #91 | Exceptional 95.6% |
| Immigrants | Saudi Arabia | 98.8 /100 | #92 | Exceptional 95.6% |
| Immigrants | Germany | 98.7 /100 | #93 | Exceptional 95.6% |
| Immigrants | Latvia | 98.7 /100 | #94 | Exceptional 95.6% |
| Americans | 98.5 /100 | #95 | Exceptional 95.6% |
| Filipinos | 98.5 /100 | #96 | Exceptional 95.6% |
Demographics Similar to Ethiopians by 9th Grade
In terms of 9th grade, the demographic groups most similar to Ethiopians are Subsaharan African (94.4%, a difference of 0.0%), Tongan (94.4%, a difference of 0.020%), Immigrants from Sierra Leone (94.4%, a difference of 0.020%), Lumbee (94.4%, a difference of 0.030%), and Immigrants from Southern Europe (94.3%, a difference of 0.030%).
| Demographics | Rating | Rank | 9th Grade |
| Portuguese | 9.2 /100 | #218 | Tragic 94.5% |
| Africans | 9.0 /100 | #219 | Tragic 94.5% |
| Indians (Asian) | 8.6 /100 | #220 | Tragic 94.5% |
| Immigrants | Eastern Africa | 8.2 /100 | #221 | Tragic 94.5% |
| Immigrants | Asia | 7.7 /100 | #222 | Tragic 94.4% |
| Bahamians | 7.0 /100 | #223 | Tragic 94.4% |
| Tongans | 6.0 /100 | #224 | Tragic 94.4% |
| Ethiopians | 5.4 /100 | #225 | Tragic 94.4% |
| Sub-Saharan Africans | 5.4 /100 | #226 | Tragic 94.4% |
| Immigrants | Sierra Leone | 4.8 /100 | #227 | Tragic 94.4% |
| Lumbee | 4.7 /100 | #228 | Tragic 94.4% |
| Immigrants | Southern Europe | 4.5 /100 | #229 | Tragic 94.3% |
| Apache | 4.2 /100 | #230 | Tragic 94.3% |
| Immigrants | Panama | 4.0 /100 | #231 | Tragic 94.3% |
| Immigrants | Africa | 3.9 /100 | #232 | Tragic 94.3% |