Iroquois vs Ethiopian Average Family Size
COMPARE
Iroquois
Ethiopian
Average Family Size
Average Family Size Comparison
Iroquois
Ethiopians
3.16
AVERAGE FAMILY SIZE
0.8/ 100
METRIC RATING
267th/ 347
METRIC RANK
3.24
AVERAGE FAMILY SIZE
63.9/ 100
METRIC RATING
159th/ 347
METRIC RANK
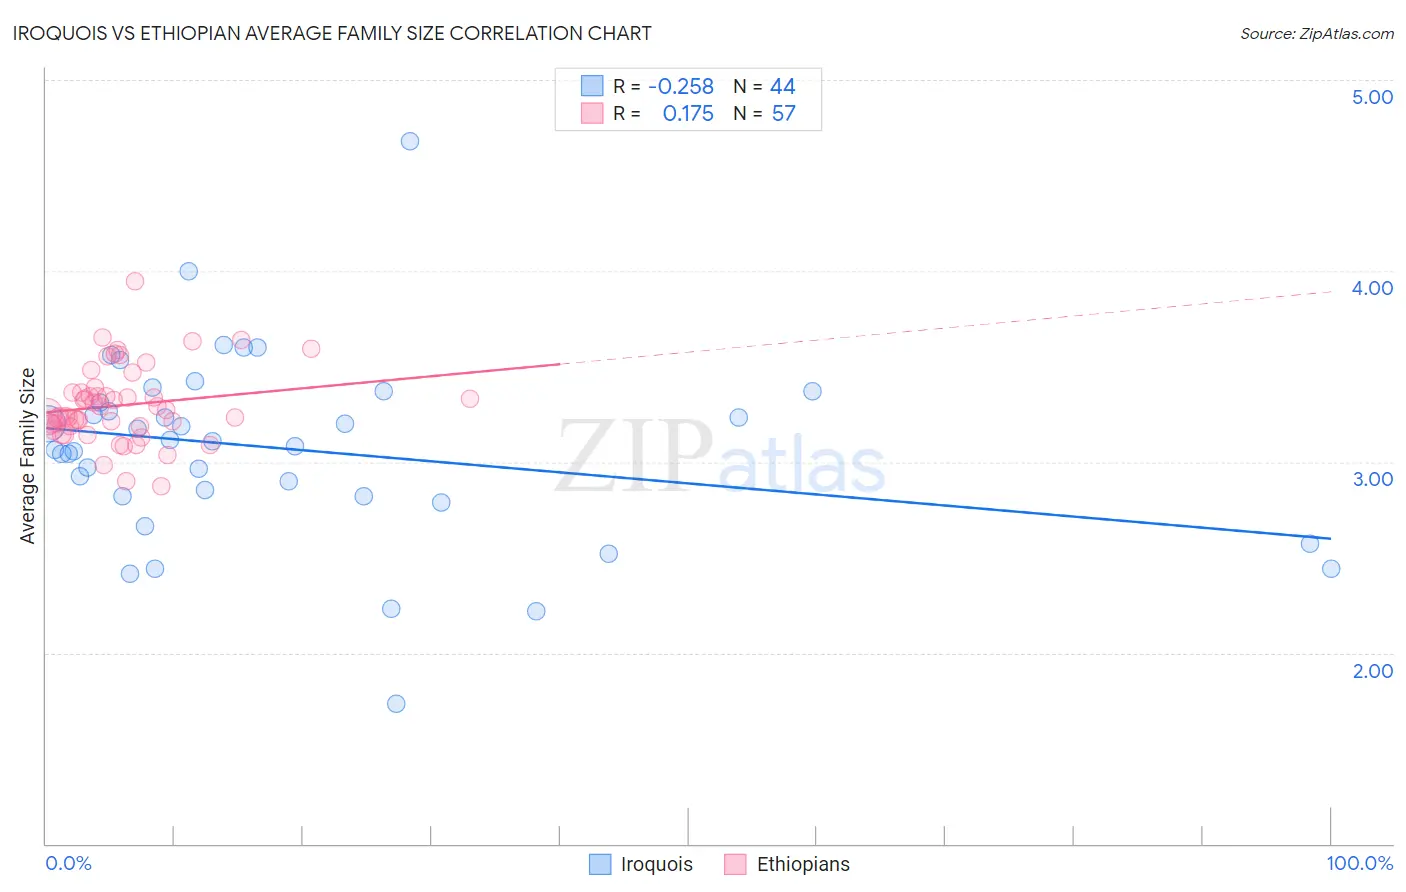
Iroquois vs Ethiopian Average Family Size Correlation Chart
The statistical analysis conducted on geographies consisting of 207,249,368 people shows a weak negative correlation between the proportion of Iroquois and average family size in the United States with a correlation coefficient (R) of -0.258 and weighted average of 3.16. Similarly, the statistical analysis conducted on geographies consisting of 223,060,111 people shows a poor positive correlation between the proportion of Ethiopians and average family size in the United States with a correlation coefficient (R) of 0.175 and weighted average of 3.24, a difference of 2.5%.
Average Family Size Correlation Summary
| Measurement | Iroquois | Ethiopian |
| Minimum | 1.73 | 2.87 |
| Maximum | 4.68 | 3.94 |
| Range | 2.95 | 1.07 |
| Mean | 3.07 | 3.30 |
| Median | 3.10 | 3.25 |
| Interquartile 25% (IQ1) | 2.82 | 3.19 |
| Interquartile 75% (IQ3) | 3.34 | 3.36 |
| Interquartile Range (IQR) | 0.52 | 0.18 |
| Standard Deviation (Sample) | 0.50 | 0.20 |
| Standard Deviation (Population) | 0.50 | 0.20 |
Similar Demographics by Average Family Size
Demographics Similar to Iroquois by Average Family Size
In terms of average family size, the demographic groups most similar to Iroquois are Immigrants from Greece (3.16, a difference of 0.020%), Immigrants from South Africa (3.16, a difference of 0.030%), Maltese (3.16, a difference of 0.040%), Immigrants from Singapore (3.16, a difference of 0.050%), and American (3.16, a difference of 0.080%).
| Demographics | Rating | Rank | Average Family Size |
| Immigrants | Albania | 1.3 /100 | #260 | Tragic 3.16 |
| Immigrants | North Macedonia | 1.3 /100 | #261 | Tragic 3.16 |
| Immigrants | Russia | 1.3 /100 | #262 | Tragic 3.16 |
| Immigrants | Bulgaria | 1.0 /100 | #263 | Tragic 3.16 |
| Americans | 1.0 /100 | #264 | Tragic 3.16 |
| Immigrants | South Africa | 0.9 /100 | #265 | Tragic 3.16 |
| Immigrants | Greece | 0.9 /100 | #266 | Tragic 3.16 |
| Iroquois | 0.8 /100 | #267 | Tragic 3.16 |
| Maltese | 0.8 /100 | #268 | Tragic 3.16 |
| Immigrants | Singapore | 0.7 /100 | #269 | Tragic 3.16 |
| Tlingit-Haida | 0.7 /100 | #270 | Tragic 3.16 |
| Immigrants | Germany | 0.7 /100 | #271 | Tragic 3.15 |
| Immigrants | Lithuania | 0.6 /100 | #272 | Tragic 3.15 |
| New Zealanders | 0.6 /100 | #273 | Tragic 3.15 |
| Immigrants | Belgium | 0.6 /100 | #274 | Tragic 3.15 |
Demographics Similar to Ethiopians by Average Family Size
In terms of average family size, the demographic groups most similar to Ethiopians are Iraqi (3.24, a difference of 0.010%), Immigrants from Iraq (3.24, a difference of 0.010%), Immigrants from Chile (3.24, a difference of 0.010%), Immigrants from Uzbekistan (3.24, a difference of 0.060%), and Immigrants from Uganda (3.23, a difference of 0.070%).
| Demographics | Rating | Rank | Average Family Size |
| Spanish Americans | 72.5 /100 | #152 | Good 3.24 |
| Immigrants | Eritrea | 71.4 /100 | #153 | Good 3.24 |
| Immigrants | Egypt | 70.0 /100 | #154 | Good 3.24 |
| Seminole | 68.2 /100 | #155 | Good 3.24 |
| Immigrants | Taiwan | 68.1 /100 | #156 | Good 3.24 |
| Immigrants | Uzbekistan | 67.0 /100 | #157 | Good 3.24 |
| Iraqis | 64.3 /100 | #158 | Good 3.24 |
| Ethiopians | 63.9 /100 | #159 | Good 3.24 |
| Immigrants | Iraq | 63.7 /100 | #160 | Good 3.24 |
| Immigrants | Chile | 63.2 /100 | #161 | Good 3.24 |
| Immigrants | Uganda | 60.1 /100 | #162 | Good 3.23 |
| Uruguayans | 58.8 /100 | #163 | Average 3.23 |
| Egyptians | 58.6 /100 | #164 | Average 3.23 |
| Ugandans | 58.4 /100 | #165 | Average 3.23 |
| Immigrants | Senegal | 57.5 /100 | #166 | Average 3.23 |