Bangladeshi vs Ethiopian Average Family Size
COMPARE
Bangladeshi
Ethiopian
Average Family Size
Average Family Size Comparison
Bangladeshis
Ethiopians
3.37
AVERAGE FAMILY SIZE
100.0/ 100
METRIC RATING
49th/ 347
METRIC RANK
3.24
AVERAGE FAMILY SIZE
63.9/ 100
METRIC RATING
159th/ 347
METRIC RANK
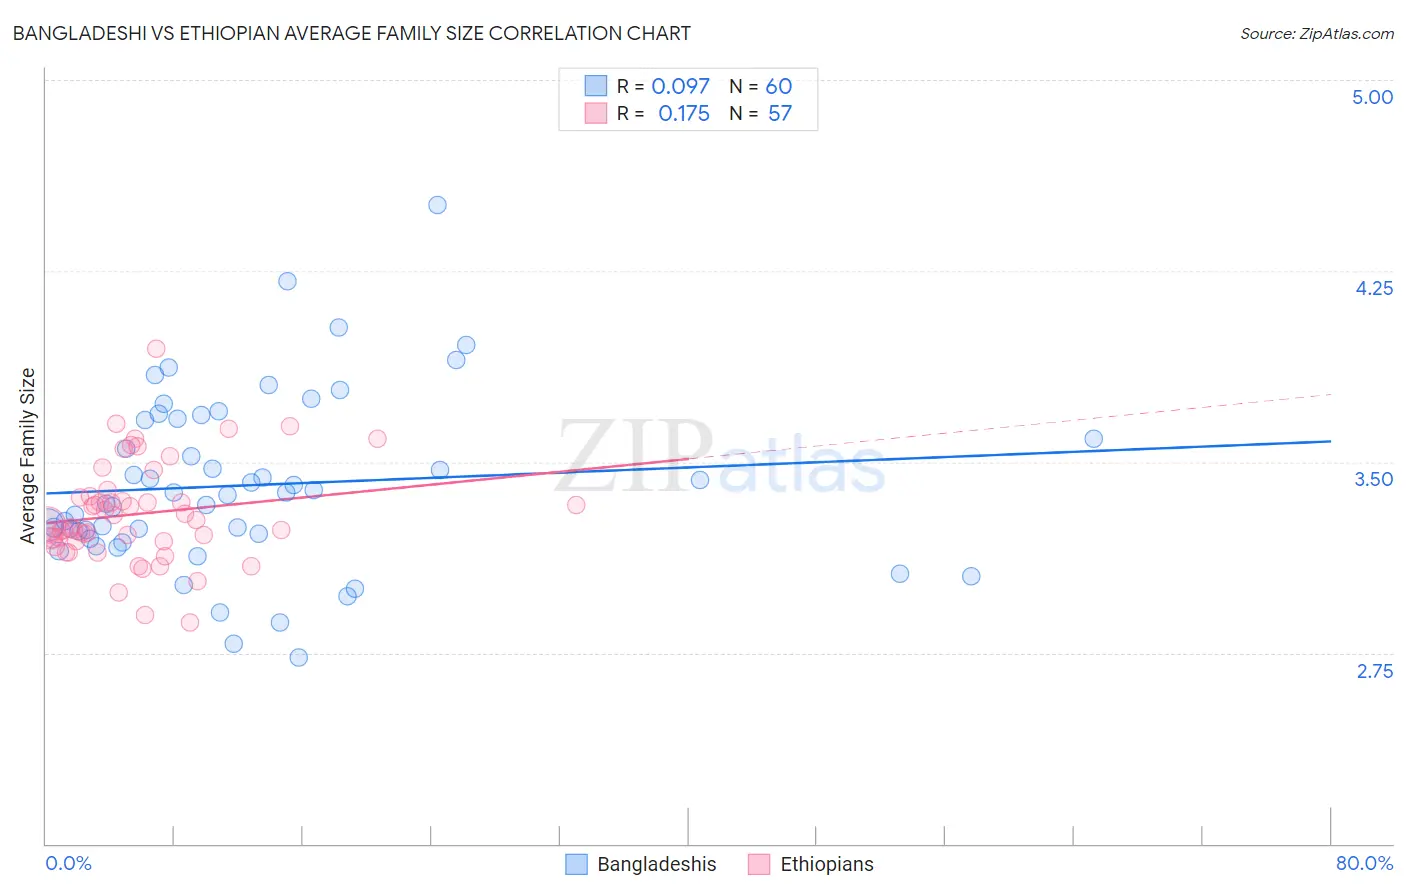
Bangladeshi vs Ethiopian Average Family Size Correlation Chart
The statistical analysis conducted on geographies consisting of 141,330,696 people shows a slight positive correlation between the proportion of Bangladeshis and average family size in the United States with a correlation coefficient (R) of 0.097 and weighted average of 3.37. Similarly, the statistical analysis conducted on geographies consisting of 223,060,111 people shows a poor positive correlation between the proportion of Ethiopians and average family size in the United States with a correlation coefficient (R) of 0.175 and weighted average of 3.24, a difference of 4.1%.
Average Family Size Correlation Summary
| Measurement | Bangladeshi | Ethiopian |
| Minimum | 2.73 | 2.87 |
| Maximum | 4.51 | 3.94 |
| Range | 1.78 | 1.07 |
| Mean | 3.41 | 3.30 |
| Median | 3.37 | 3.25 |
| Interquartile 25% (IQ1) | 3.21 | 3.19 |
| Interquartile 75% (IQ3) | 3.67 | 3.36 |
| Interquartile Range (IQR) | 0.46 | 0.18 |
| Standard Deviation (Sample) | 0.34 | 0.20 |
| Standard Deviation (Population) | 0.34 | 0.20 |
Similar Demographics by Average Family Size
Demographics Similar to Bangladeshis by Average Family Size
In terms of average family size, the demographic groups most similar to Bangladeshis are Immigrants from Nicaragua (3.37, a difference of 0.060%), Vietnamese (3.37, a difference of 0.070%), Haitian (3.37, a difference of 0.11%), Immigrants from Bangladesh (3.36, a difference of 0.14%), and Shoshone (3.37, a difference of 0.16%).
| Demographics | Rating | Rank | Average Family Size |
| Immigrants | Vietnam | 100.0 /100 | #42 | Exceptional 3.38 |
| Immigrants | Philippines | 100.0 /100 | #43 | Exceptional 3.37 |
| Alaska Natives | 100.0 /100 | #44 | Exceptional 3.37 |
| Shoshone | 100.0 /100 | #45 | Exceptional 3.37 |
| Haitians | 100.0 /100 | #46 | Exceptional 3.37 |
| Vietnamese | 100.0 /100 | #47 | Exceptional 3.37 |
| Immigrants | Nicaragua | 100.0 /100 | #48 | Exceptional 3.37 |
| Bangladeshis | 100.0 /100 | #49 | Exceptional 3.37 |
| Immigrants | Bangladesh | 100.0 /100 | #50 | Exceptional 3.36 |
| Nicaraguans | 100.0 /100 | #51 | Exceptional 3.36 |
| Fijians | 100.0 /100 | #52 | Exceptional 3.36 |
| Koreans | 100.0 /100 | #53 | Exceptional 3.36 |
| Immigrants | South Eastern Asia | 100.0 /100 | #54 | Exceptional 3.36 |
| Immigrants | Honduras | 100.0 /100 | #55 | Exceptional 3.36 |
| Immigrants | Dominican Republic | 100.0 /100 | #56 | Exceptional 3.35 |
Demographics Similar to Ethiopians by Average Family Size
In terms of average family size, the demographic groups most similar to Ethiopians are Iraqi (3.24, a difference of 0.010%), Immigrants from Iraq (3.24, a difference of 0.010%), Immigrants from Chile (3.24, a difference of 0.010%), Immigrants from Uzbekistan (3.24, a difference of 0.060%), and Immigrants from Uganda (3.23, a difference of 0.070%).
| Demographics | Rating | Rank | Average Family Size |
| Spanish Americans | 72.5 /100 | #152 | Good 3.24 |
| Immigrants | Eritrea | 71.4 /100 | #153 | Good 3.24 |
| Immigrants | Egypt | 70.0 /100 | #154 | Good 3.24 |
| Seminole | 68.2 /100 | #155 | Good 3.24 |
| Immigrants | Taiwan | 68.1 /100 | #156 | Good 3.24 |
| Immigrants | Uzbekistan | 67.0 /100 | #157 | Good 3.24 |
| Iraqis | 64.3 /100 | #158 | Good 3.24 |
| Ethiopians | 63.9 /100 | #159 | Good 3.24 |
| Immigrants | Iraq | 63.7 /100 | #160 | Good 3.24 |
| Immigrants | Chile | 63.2 /100 | #161 | Good 3.24 |
| Immigrants | Uganda | 60.1 /100 | #162 | Good 3.23 |
| Uruguayans | 58.8 /100 | #163 | Average 3.23 |
| Egyptians | 58.6 /100 | #164 | Average 3.23 |
| Ugandans | 58.4 /100 | #165 | Average 3.23 |
| Immigrants | Senegal | 57.5 /100 | #166 | Average 3.23 |