Yugoslavian vs Colville Disability Age Under 5
COMPARE
Yugoslavian
Colville
Disability Age Under 5
Disability Age Under 5 Comparison
Yugoslavians
Colville
1.4%
DISABILITY AGE UNDER 5
0.1/ 100
METRIC RATING
264th/ 347
METRIC RANK
3.3%
DISABILITY AGE UNDER 5
0.0/ 100
METRIC RATING
343rd/ 347
METRIC RANK
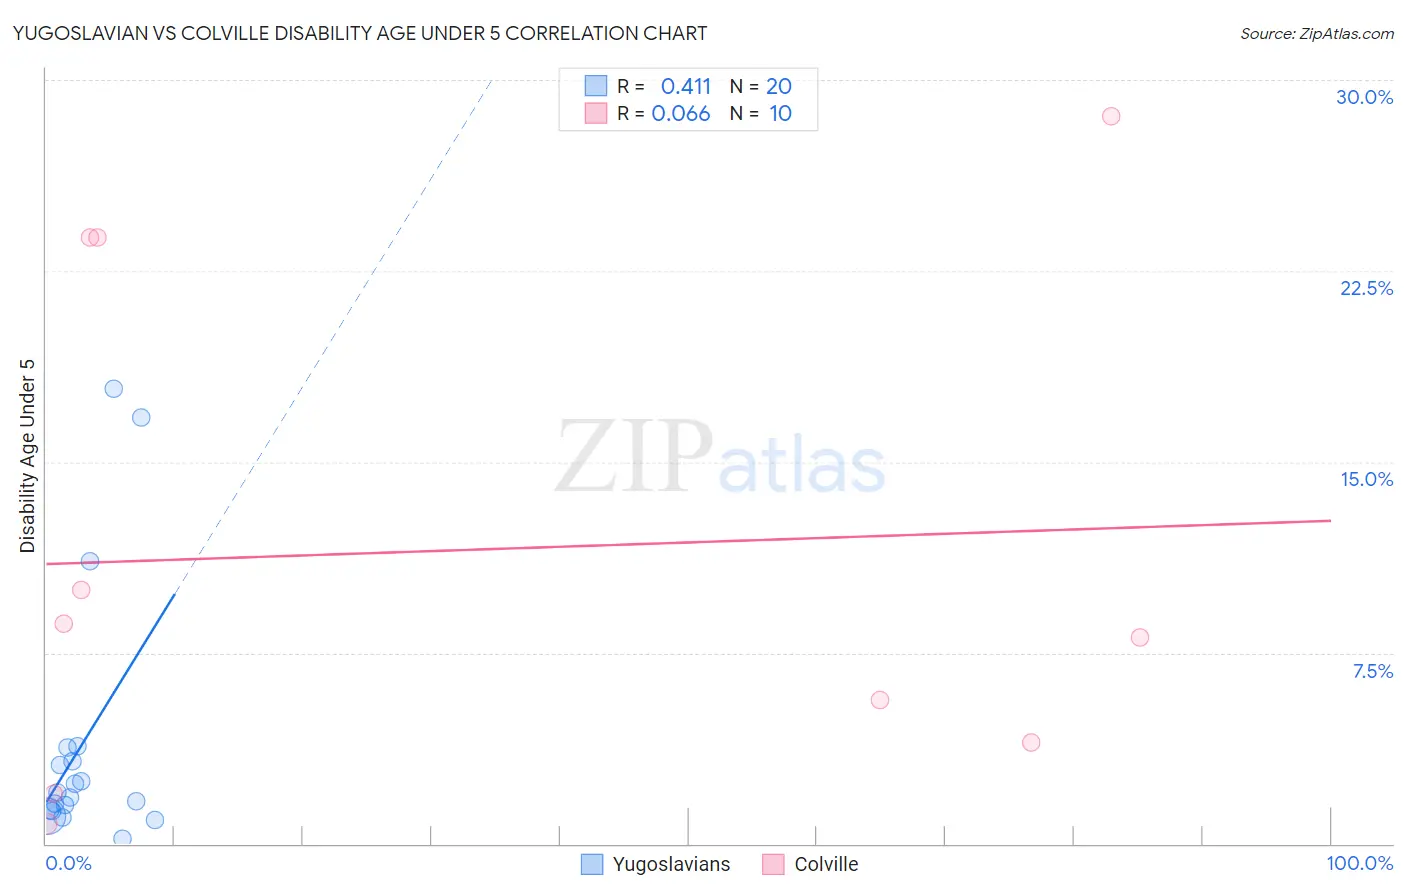
Yugoslavian vs Colville Disability Age Under 5 Correlation Chart
The statistical analysis conducted on geographies consisting of 169,705,353 people shows a moderate positive correlation between the proportion of Yugoslavians and percentage of population with a disability under the age of 5 in the United States with a correlation coefficient (R) of 0.411 and weighted average of 1.4%. Similarly, the statistical analysis conducted on geographies consisting of 29,840,088 people shows a slight positive correlation between the proportion of Colville and percentage of population with a disability under the age of 5 in the United States with a correlation coefficient (R) of 0.066 and weighted average of 3.3%, a difference of 130.9%.
Disability Age Under 5 Correlation Summary
| Measurement | Yugoslavian | Colville |
| Minimum | 0.18% | 0.81% |
| Maximum | 17.9% | 28.6% |
| Range | 17.7% | 27.8% |
| Mean | 3.9% | 11.5% |
| Median | 1.9% | 8.4% |
| Interquartile 25% (IQ1) | 1.3% | 4.0% |
| Interquartile 75% (IQ3) | 3.5% | 23.8% |
| Interquartile Range (IQR) | 2.2% | 19.8% |
| Standard Deviation (Sample) | 5.1% | 10.1% |
| Standard Deviation (Population) | 5.0% | 9.6% |
Similar Demographics by Disability Age Under 5
Demographics Similar to Yugoslavians by Disability Age Under 5
In terms of disability age under 5, the demographic groups most similar to Yugoslavians are Carpatho Rusyn (1.4%, a difference of 0.040%), Immigrants from Germany (1.4%, a difference of 0.080%), Spanish (1.4%, a difference of 0.15%), Immigrants from Dominica (1.4%, a difference of 0.21%), and Immigrants from Netherlands (1.4%, a difference of 0.37%).
| Demographics | Rating | Rank | Disability Age Under 5 |
| Slovenes | 0.3 /100 | #257 | Tragic 1.4% |
| Costa Ricans | 0.3 /100 | #258 | Tragic 1.4% |
| Immigrants | Southern Europe | 0.3 /100 | #259 | Tragic 1.4% |
| Slavs | 0.3 /100 | #260 | Tragic 1.4% |
| Immigrants | Netherlands | 0.2 /100 | #261 | Tragic 1.4% |
| Immigrants | Dominica | 0.2 /100 | #262 | Tragic 1.4% |
| Spanish | 0.2 /100 | #263 | Tragic 1.4% |
| Yugoslavians | 0.1 /100 | #264 | Tragic 1.4% |
| Carpatho Rusyns | 0.1 /100 | #265 | Tragic 1.4% |
| Immigrants | Germany | 0.1 /100 | #266 | Tragic 1.4% |
| Cree | 0.1 /100 | #267 | Tragic 1.4% |
| Belgians | 0.1 /100 | #268 | Tragic 1.4% |
| Austrians | 0.1 /100 | #269 | Tragic 1.4% |
| Immigrants | North America | 0.1 /100 | #270 | Tragic 1.4% |
| Immigrants | Canada | 0.1 /100 | #271 | Tragic 1.4% |
Demographics Similar to Colville by Disability Age Under 5
In terms of disability age under 5, the demographic groups most similar to Colville are Alaska Native (2.9%, a difference of 11.6%), Inupiat (3.7%, a difference of 13.0%), Paiute (3.9%, a difference of 19.0%), Tsimshian (2.4%, a difference of 36.3%), and Yup'ik (4.5%, a difference of 37.8%).
| Demographics | Rating | Rank | Disability Age Under 5 |
| Dutch West Indians | 0.0 /100 | #333 | Tragic 1.9% |
| Natives/Alaskans | 0.0 /100 | #334 | Tragic 1.9% |
| Pennsylvania Germans | 0.0 /100 | #335 | Tragic 1.9% |
| Paraguayans | 0.0 /100 | #336 | Tragic 2.0% |
| Apache | 0.0 /100 | #337 | Tragic 2.0% |
| Tohono O'odham | 0.0 /100 | #338 | Tragic 2.2% |
| Immigrants | Azores | 0.0 /100 | #339 | Tragic 2.2% |
| Menominee | 0.0 /100 | #340 | Tragic 2.3% |
| Tsimshian | 0.0 /100 | #341 | Tragic 2.4% |
| Alaska Natives | 0.0 /100 | #342 | Tragic 2.9% |
| Colville | 0.0 /100 | #343 | Tragic 3.3% |
| Inupiat | 0.0 /100 | #344 | Tragic 3.7% |
| Paiute | 0.0 /100 | #345 | Tragic 3.9% |
| Yup'ik | 0.0 /100 | #346 | Tragic 4.5% |
| Hopi | 0.0 /100 | #347 | Tragic 4.6% |