Tsimshian vs Brazilian Divorced or Separated
COMPARE
Tsimshian
Brazilian
Divorced or Separated
Divorced or Separated Comparison
Tsimshian
Brazilians
13.3%
DIVORCED OR SEPARATED
0.0/ 100
METRIC RATING
316th/ 347
METRIC RANK
12.1%
DIVORCED OR SEPARATED
47.7/ 100
METRIC RATING
177th/ 347
METRIC RANK
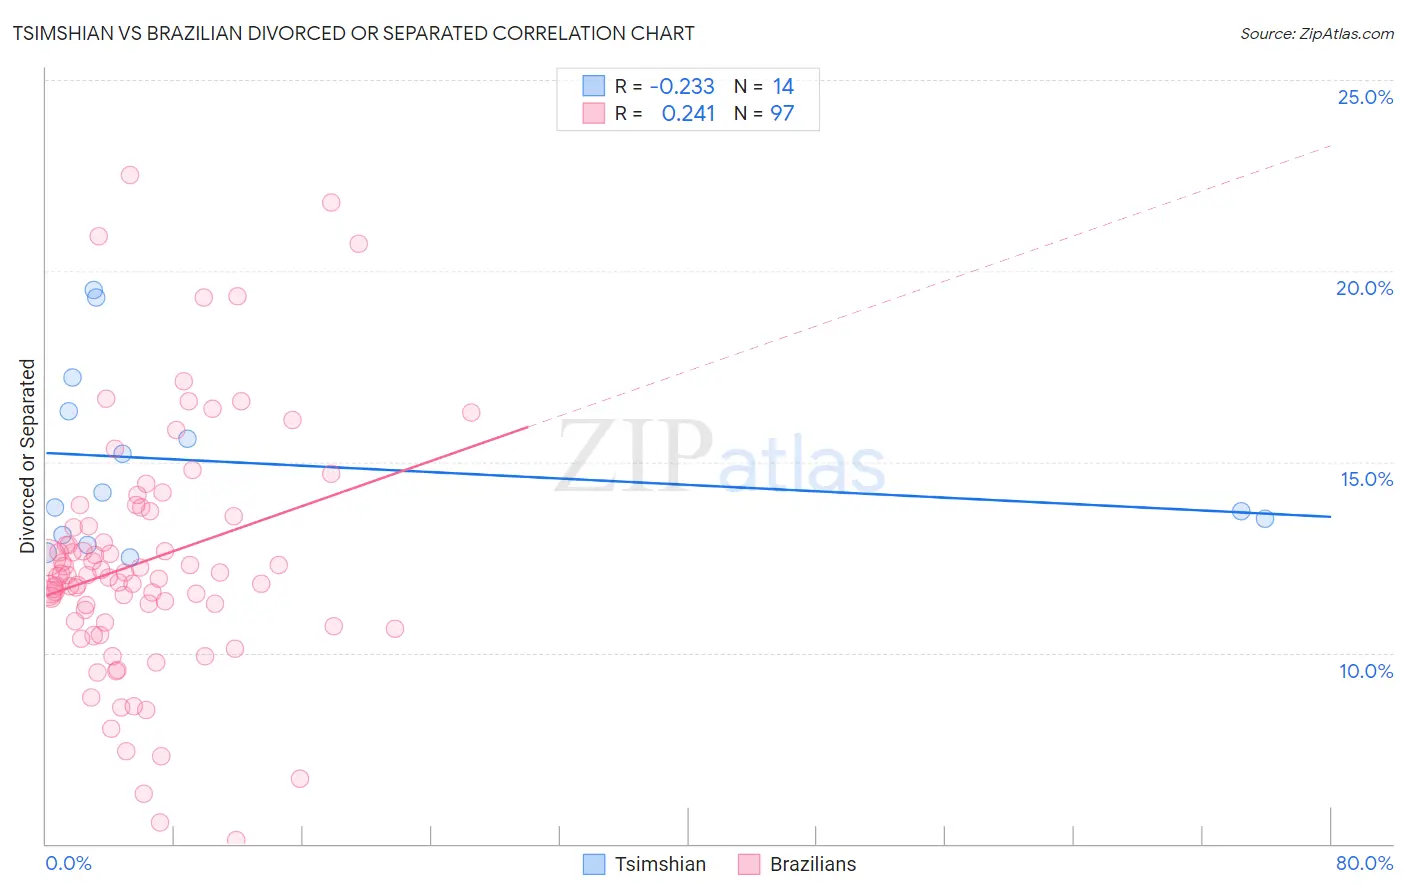
Tsimshian vs Brazilian Divorced or Separated Correlation Chart
The statistical analysis conducted on geographies consisting of 15,626,183 people shows a weak negative correlation between the proportion of Tsimshian and percentage of population currently divorced or separated in the United States with a correlation coefficient (R) of -0.233 and weighted average of 13.3%. Similarly, the statistical analysis conducted on geographies consisting of 323,792,537 people shows a weak positive correlation between the proportion of Brazilians and percentage of population currently divorced or separated in the United States with a correlation coefficient (R) of 0.241 and weighted average of 12.1%, a difference of 10.6%.
Divorced or Separated Correlation Summary
| Measurement | Tsimshian | Brazilian |
| Minimum | 12.5% | 5.1% |
| Maximum | 19.5% | 22.5% |
| Range | 7.0% | 17.4% |
| Mean | 15.0% | 12.4% |
| Median | 14.0% | 12.1% |
| Interquartile 25% (IQ1) | 13.1% | 10.8% |
| Interquartile 75% (IQ3) | 16.3% | 13.6% |
| Interquartile Range (IQR) | 3.2% | 2.8% |
| Standard Deviation (Sample) | 2.4% | 3.2% |
| Standard Deviation (Population) | 2.3% | 3.2% |
Similar Demographics by Divorced or Separated
Demographics Similar to Tsimshian by Divorced or Separated
In terms of divorced or separated, the demographic groups most similar to Tsimshian are Haitian (13.3%, a difference of 0.020%), Spanish American (13.3%, a difference of 0.030%), Cree (13.4%, a difference of 0.050%), Puget Sound Salish (13.4%, a difference of 0.080%), and Cajun (13.4%, a difference of 0.14%).
| Demographics | Rating | Rank | Divorced or Separated |
| Americans | 0.0 /100 | #309 | Tragic 13.2% |
| Africans | 0.0 /100 | #310 | Tragic 13.2% |
| Sioux | 0.0 /100 | #311 | Tragic 13.2% |
| Blackfeet | 0.0 /100 | #312 | Tragic 13.3% |
| Immigrants | Nicaragua | 0.0 /100 | #313 | Tragic 13.3% |
| Yaqui | 0.0 /100 | #314 | Tragic 13.3% |
| Spanish Americans | 0.0 /100 | #315 | Tragic 13.3% |
| Tsimshian | 0.0 /100 | #316 | Tragic 13.3% |
| Haitians | 0.0 /100 | #317 | Tragic 13.3% |
| Cree | 0.0 /100 | #318 | Tragic 13.4% |
| Puget Sound Salish | 0.0 /100 | #319 | Tragic 13.4% |
| Cajuns | 0.0 /100 | #320 | Tragic 13.4% |
| Cheyenne | 0.0 /100 | #321 | Tragic 13.4% |
| Immigrants | Haiti | 0.0 /100 | #322 | Tragic 13.4% |
| U.S. Virgin Islanders | 0.0 /100 | #323 | Tragic 13.4% |
Demographics Similar to Brazilians by Divorced or Separated
In terms of divorced or separated, the demographic groups most similar to Brazilians are Pennsylvania German (12.1%, a difference of 0.040%), Ghanaian (12.1%, a difference of 0.060%), Hawaiian (12.1%, a difference of 0.080%), Immigrants from Sierra Leone (12.1%, a difference of 0.080%), and Immigrants from Western Europe (12.1%, a difference of 0.080%).
| Demographics | Rating | Rank | Divorced or Separated |
| Mexican American Indians | 55.8 /100 | #170 | Average 12.0% |
| Costa Ricans | 53.3 /100 | #171 | Average 12.0% |
| Immigrants | Mexico | 53.2 /100 | #172 | Average 12.0% |
| Immigrants | Moldova | 50.4 /100 | #173 | Average 12.1% |
| Hawaiians | 50.0 /100 | #174 | Average 12.1% |
| Immigrants | Sierra Leone | 50.0 /100 | #175 | Average 12.1% |
| Pennsylvania Germans | 48.9 /100 | #176 | Average 12.1% |
| Brazilians | 47.7 /100 | #177 | Average 12.1% |
| Ghanaians | 45.9 /100 | #178 | Average 12.1% |
| Immigrants | Western Europe | 45.6 /100 | #179 | Average 12.1% |
| Barbadians | 45.0 /100 | #180 | Average 12.1% |
| Immigrants | Canada | 44.0 /100 | #181 | Average 12.1% |
| Immigrants | Ethiopia | 43.1 /100 | #182 | Average 12.1% |
| Immigrants | Central America | 42.9 /100 | #183 | Average 12.1% |
| Immigrants | North America | 41.1 /100 | #184 | Average 12.1% |