Yaqui vs Taiwanese Single Father Households
COMPARE
Yaqui
Taiwanese
Single Father Households
Single Father Households Comparison
Yaqui
Taiwanese
3.2%
SINGLE FATHER HOUSEHOLDS
0.0/ 100
METRIC RATING
332nd/ 347
METRIC RANK
2.2%
SINGLE FATHER HOUSEHOLDS
96.3/ 100
METRIC RATING
133rd/ 347
METRIC RANK
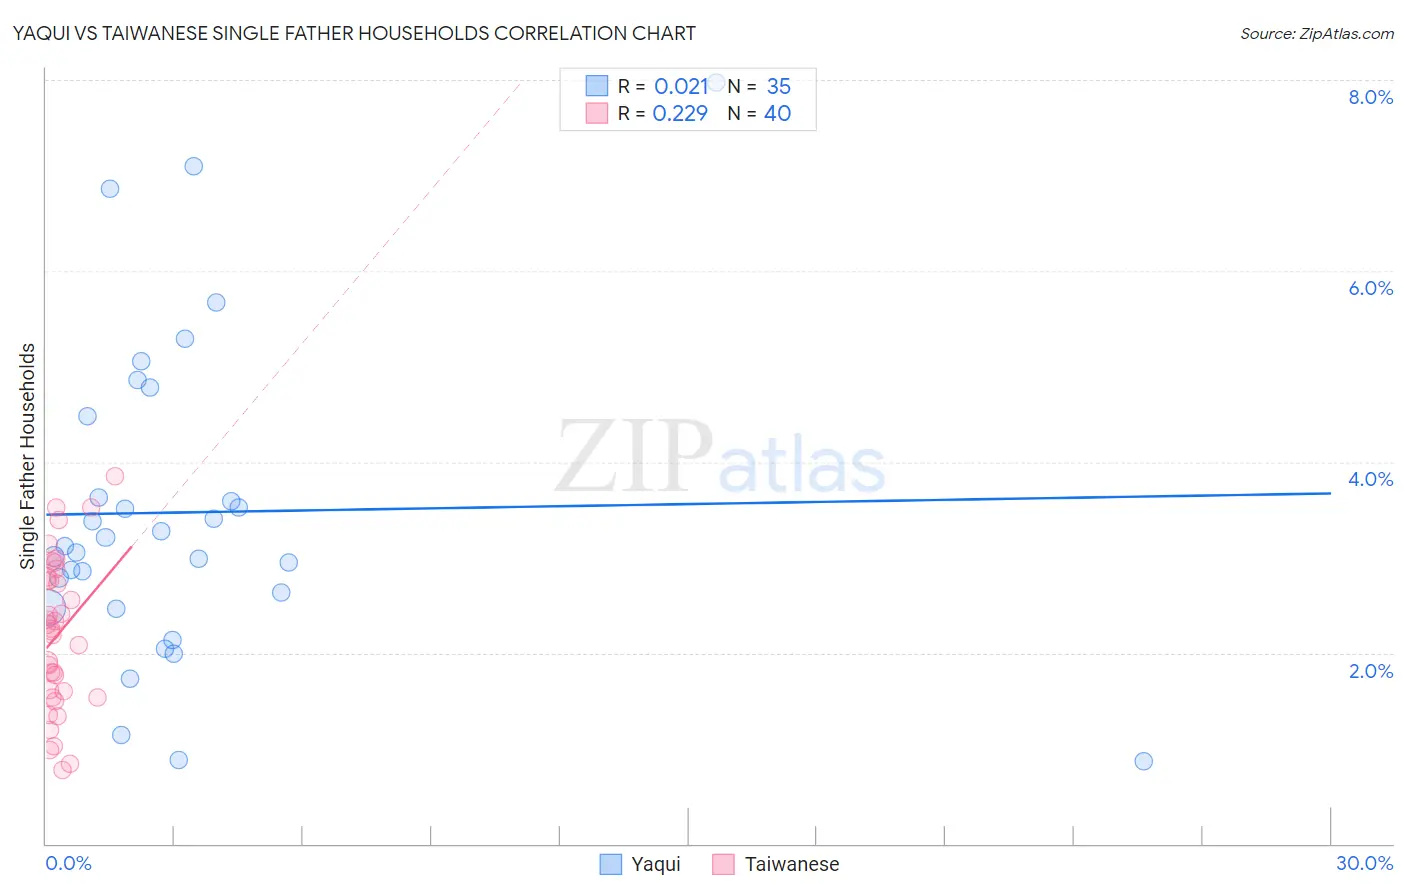
Yaqui vs Taiwanese Single Father Households Correlation Chart
The statistical analysis conducted on geographies consisting of 107,422,913 people shows no correlation between the proportion of Yaqui and percentage of single father households in the United States with a correlation coefficient (R) of 0.021 and weighted average of 3.2%. Similarly, the statistical analysis conducted on geographies consisting of 31,679,530 people shows a weak positive correlation between the proportion of Taiwanese and percentage of single father households in the United States with a correlation coefficient (R) of 0.229 and weighted average of 2.2%, a difference of 45.2%.
Single Father Households Correlation Summary
| Measurement | Yaqui | Taiwanese |
| Minimum | 0.87% | 0.77% |
| Maximum | 8.0% | 3.9% |
| Range | 7.1% | 3.1% |
| Mean | 3.5% | 2.2% |
| Median | 3.1% | 2.2% |
| Interquartile 25% (IQ1) | 2.5% | 1.6% |
| Interquartile 75% (IQ3) | 4.5% | 2.8% |
| Interquartile Range (IQR) | 2.0% | 1.2% |
| Standard Deviation (Sample) | 1.7% | 0.79% |
| Standard Deviation (Population) | 1.6% | 0.78% |
Similar Demographics by Single Father Households
Demographics Similar to Yaqui by Single Father Households
In terms of single father households, the demographic groups most similar to Yaqui are Navajo (3.2%, a difference of 0.040%), Native/Alaskan (3.2%, a difference of 0.49%), Nepalese (3.1%, a difference of 2.3%), Chippewa (3.1%, a difference of 3.2%), and Yuman (3.3%, a difference of 3.3%).
| Demographics | Rating | Rank | Single Father Households |
| Immigrants | Mexico | 0.0 /100 | #325 | Tragic 3.0% |
| Aleuts | 0.0 /100 | #326 | Tragic 3.0% |
| Bangladeshis | 0.0 /100 | #327 | Tragic 3.1% |
| Immigrants | Cabo Verde | 0.0 /100 | #328 | Tragic 3.1% |
| Chippewa | 0.0 /100 | #329 | Tragic 3.1% |
| Nepalese | 0.0 /100 | #330 | Tragic 3.1% |
| Navajo | 0.0 /100 | #331 | Tragic 3.2% |
| Yaqui | 0.0 /100 | #332 | Tragic 3.2% |
| Natives/Alaskans | 0.0 /100 | #333 | Tragic 3.2% |
| Yuman | 0.0 /100 | #334 | Tragic 3.3% |
| Colville | 0.0 /100 | #335 | Tragic 3.3% |
| Paiute | 0.0 /100 | #336 | Tragic 3.3% |
| Pueblo | 0.0 /100 | #337 | Tragic 3.3% |
| Sioux | 0.0 /100 | #338 | Tragic 3.3% |
| Alaskan Athabascans | 0.0 /100 | #339 | Tragic 3.4% |
Demographics Similar to Taiwanese by Single Father Households
In terms of single father households, the demographic groups most similar to Taiwanese are Polish (2.2%, a difference of 0.12%), Immigrants from Jordan (2.2%, a difference of 0.13%), Immigrants from Chile (2.2%, a difference of 0.19%), Serbian (2.2%, a difference of 0.30%), and Immigrants from England (2.2%, a difference of 0.31%).
| Demographics | Rating | Rank | Single Father Households |
| Moroccans | 96.9 /100 | #126 | Exceptional 2.2% |
| Jordanians | 96.9 /100 | #127 | Exceptional 2.2% |
| Immigrants | England | 96.8 /100 | #128 | Exceptional 2.2% |
| Serbians | 96.8 /100 | #129 | Exceptional 2.2% |
| Immigrants | Chile | 96.7 /100 | #130 | Exceptional 2.2% |
| Immigrants | Jordan | 96.6 /100 | #131 | Exceptional 2.2% |
| Poles | 96.5 /100 | #132 | Exceptional 2.2% |
| Taiwanese | 96.3 /100 | #133 | Exceptional 2.2% |
| Zimbabweans | 95.1 /100 | #134 | Exceptional 2.2% |
| Syrians | 94.8 /100 | #135 | Exceptional 2.2% |
| Chileans | 94.5 /100 | #136 | Exceptional 2.2% |
| Austrians | 94.2 /100 | #137 | Exceptional 2.2% |
| West Indians | 94.1 /100 | #138 | Exceptional 2.2% |
| Brazilians | 92.8 /100 | #139 | Exceptional 2.2% |
| British | 92.8 /100 | #140 | Exceptional 2.2% |