Yaqui vs Swiss Single Father Households
COMPARE
Yaqui
Swiss
Single Father Households
Single Father Households Comparison
Yaqui
Swiss
3.2%
SINGLE FATHER HOUSEHOLDS
0.0/ 100
METRIC RATING
332nd/ 347
METRIC RANK
2.3%
SINGLE FATHER HOUSEHOLDS
73.2/ 100
METRIC RATING
161st/ 347
METRIC RANK
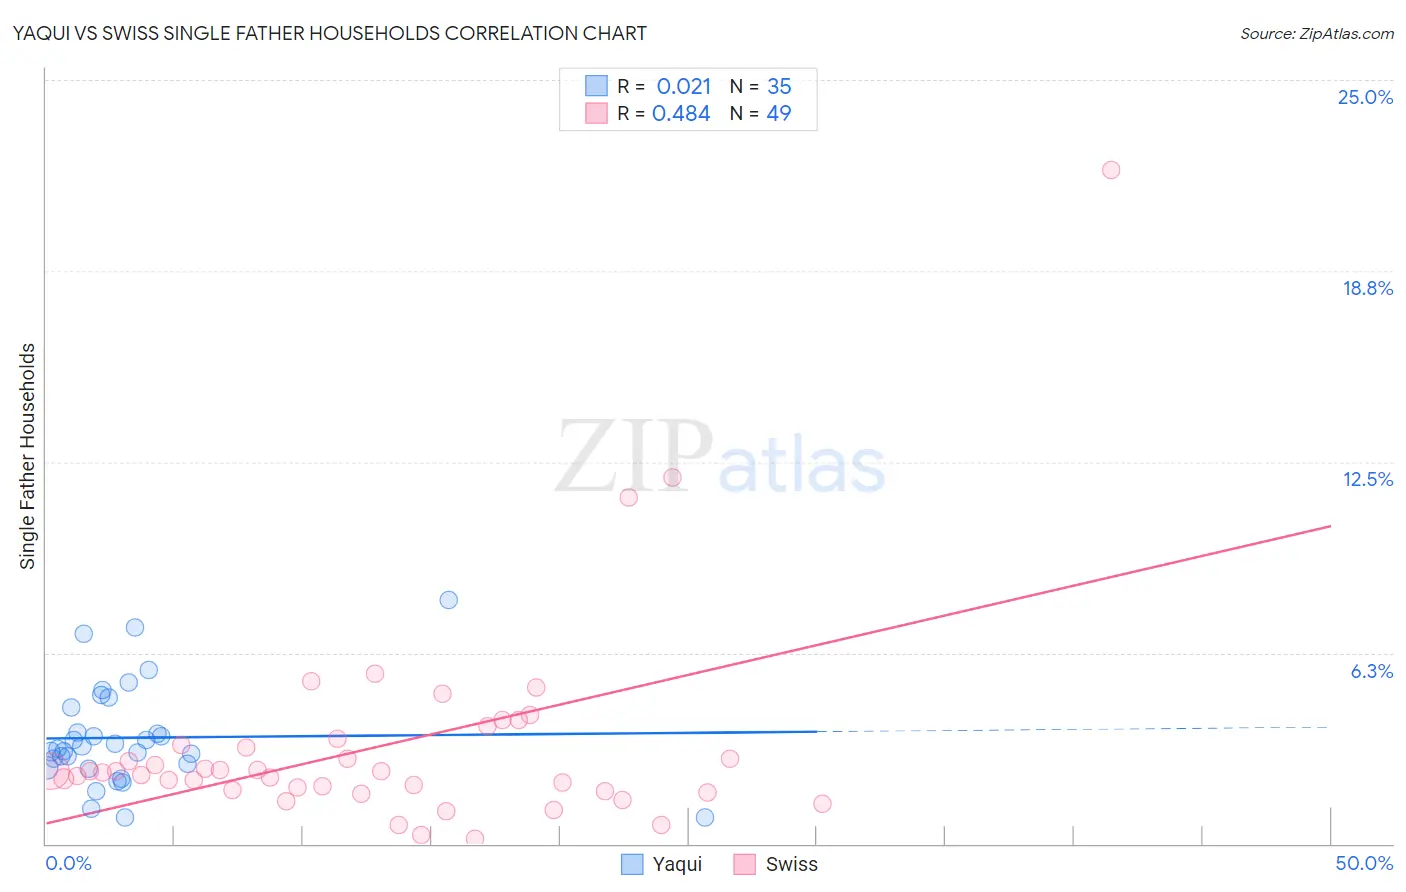
Yaqui vs Swiss Single Father Households Correlation Chart
The statistical analysis conducted on geographies consisting of 107,422,913 people shows no correlation between the proportion of Yaqui and percentage of single father households in the United States with a correlation coefficient (R) of 0.021 and weighted average of 3.2%. Similarly, the statistical analysis conducted on geographies consisting of 458,392,484 people shows a moderate positive correlation between the proportion of Swiss and percentage of single father households in the United States with a correlation coefficient (R) of 0.484 and weighted average of 2.3%, a difference of 39.0%.
Single Father Households Correlation Summary
| Measurement | Yaqui | Swiss |
| Minimum | 0.87% | 0.16% |
| Maximum | 8.0% | 22.1% |
| Range | 7.1% | 21.9% |
| Mean | 3.5% | 3.2% |
| Median | 3.1% | 2.4% |
| Interquartile 25% (IQ1) | 2.5% | 1.7% |
| Interquartile 75% (IQ3) | 4.5% | 3.3% |
| Interquartile Range (IQR) | 2.0% | 1.6% |
| Standard Deviation (Sample) | 1.7% | 3.5% |
| Standard Deviation (Population) | 1.6% | 3.5% |
Similar Demographics by Single Father Households
Demographics Similar to Yaqui by Single Father Households
In terms of single father households, the demographic groups most similar to Yaqui are Navajo (3.2%, a difference of 0.040%), Native/Alaskan (3.2%, a difference of 0.49%), Nepalese (3.1%, a difference of 2.3%), Chippewa (3.1%, a difference of 3.2%), and Yuman (3.3%, a difference of 3.3%).
| Demographics | Rating | Rank | Single Father Households |
| Immigrants | Mexico | 0.0 /100 | #325 | Tragic 3.0% |
| Aleuts | 0.0 /100 | #326 | Tragic 3.0% |
| Bangladeshis | 0.0 /100 | #327 | Tragic 3.1% |
| Immigrants | Cabo Verde | 0.0 /100 | #328 | Tragic 3.1% |
| Chippewa | 0.0 /100 | #329 | Tragic 3.1% |
| Nepalese | 0.0 /100 | #330 | Tragic 3.1% |
| Navajo | 0.0 /100 | #331 | Tragic 3.2% |
| Yaqui | 0.0 /100 | #332 | Tragic 3.2% |
| Natives/Alaskans | 0.0 /100 | #333 | Tragic 3.2% |
| Yuman | 0.0 /100 | #334 | Tragic 3.3% |
| Colville | 0.0 /100 | #335 | Tragic 3.3% |
| Paiute | 0.0 /100 | #336 | Tragic 3.3% |
| Pueblo | 0.0 /100 | #337 | Tragic 3.3% |
| Sioux | 0.0 /100 | #338 | Tragic 3.3% |
| Alaskan Athabascans | 0.0 /100 | #339 | Tragic 3.4% |
Demographics Similar to Swiss by Single Father Households
In terms of single father households, the demographic groups most similar to Swiss are Scottish (2.3%, a difference of 0.030%), Irish (2.3%, a difference of 0.11%), Pakistani (2.3%, a difference of 0.25%), Immigrants from Bolivia (2.3%, a difference of 0.30%), and Scotch-Irish (2.3%, a difference of 0.35%).
| Demographics | Rating | Rank | Single Father Households |
| Bolivians | 81.0 /100 | #154 | Excellent 2.3% |
| Europeans | 80.9 /100 | #155 | Excellent 2.3% |
| Immigrants | South America | 79.9 /100 | #156 | Good 2.3% |
| Canadians | 79.7 /100 | #157 | Good 2.3% |
| Immigrants | Senegal | 79.4 /100 | #158 | Good 2.3% |
| Immigrants | West Indies | 77.9 /100 | #159 | Good 2.3% |
| Immigrants | Bolivia | 76.3 /100 | #160 | Good 2.3% |
| Swiss | 73.2 /100 | #161 | Good 2.3% |
| Scottish | 72.8 /100 | #162 | Good 2.3% |
| Irish | 72.1 /100 | #163 | Good 2.3% |
| Pakistanis | 70.6 /100 | #164 | Good 2.3% |
| Scotch-Irish | 69.4 /100 | #165 | Good 2.3% |
| English | 68.6 /100 | #166 | Good 2.3% |
| South Americans | 64.3 /100 | #167 | Good 2.3% |
| Icelanders | 63.1 /100 | #168 | Good 2.3% |