Immigrants from Afghanistan vs Paraguayan Single Father Households
COMPARE
Immigrants from Afghanistan
Paraguayan
Single Father Households
Single Father Households Comparison
Immigrants from Afghanistan
Paraguayans
2.4%
SINGLE FATHER HOUSEHOLDS
24.2/ 100
METRIC RATING
205th/ 347
METRIC RANK
2.1%
SINGLE FATHER HOUSEHOLDS
99.9/ 100
METRIC RATING
65th/ 347
METRIC RANK
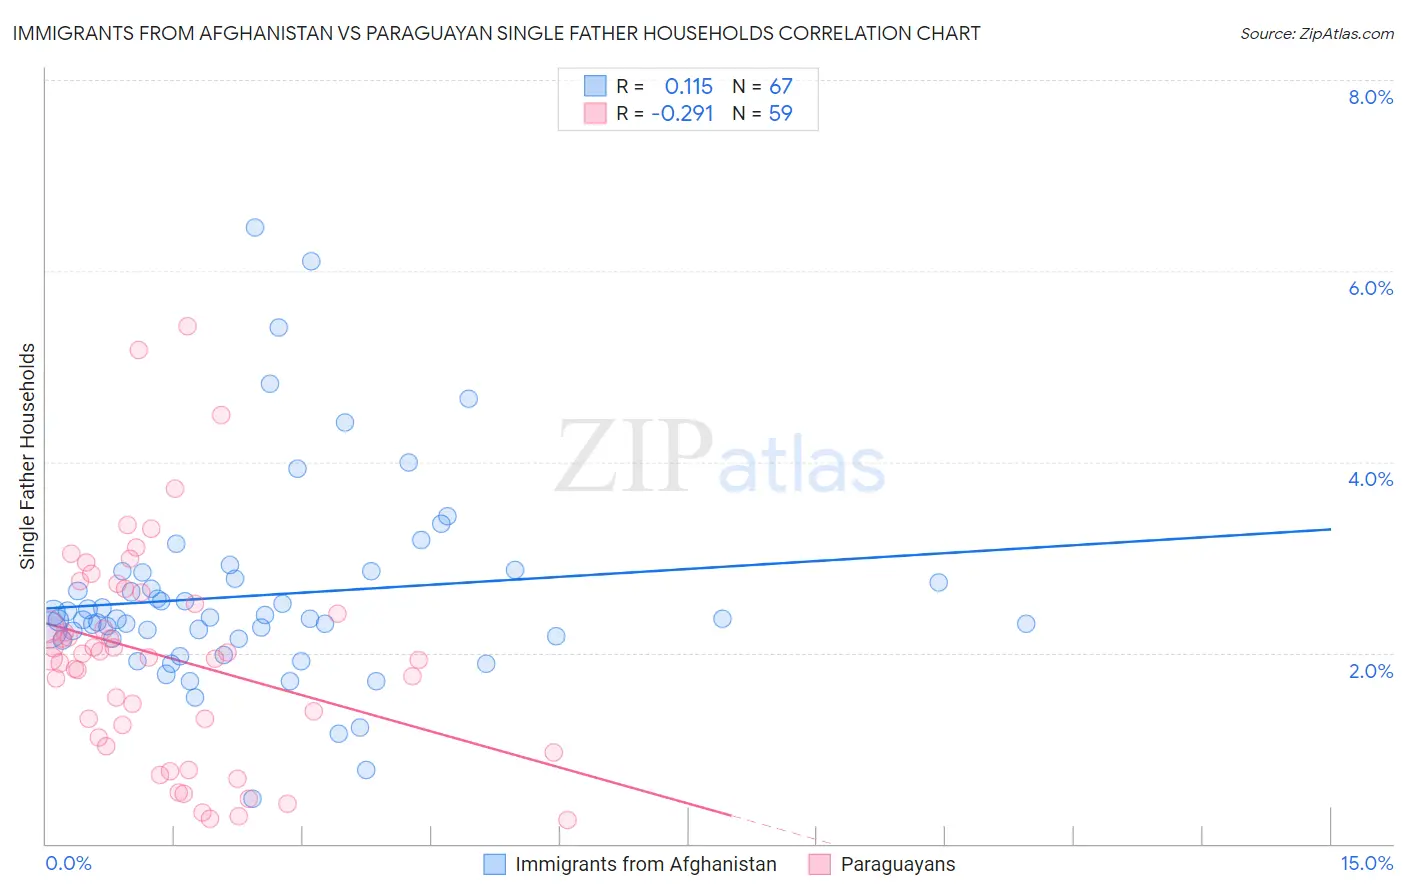
Immigrants from Afghanistan vs Paraguayan Single Father Households Correlation Chart
The statistical analysis conducted on geographies consisting of 147,265,555 people shows a poor positive correlation between the proportion of Immigrants from Afghanistan and percentage of single father households in the United States with a correlation coefficient (R) of 0.115 and weighted average of 2.4%. Similarly, the statistical analysis conducted on geographies consisting of 94,899,584 people shows a weak negative correlation between the proportion of Paraguayans and percentage of single father households in the United States with a correlation coefficient (R) of -0.291 and weighted average of 2.1%, a difference of 16.3%.
Single Father Households Correlation Summary
| Measurement | Immigrants from Afghanistan | Paraguayan |
| Minimum | 0.48% | 0.25% |
| Maximum | 6.5% | 5.4% |
| Range | 6.0% | 5.2% |
| Mean | 2.6% | 2.0% |
| Median | 2.4% | 2.0% |
| Interquartile 25% (IQ1) | 2.1% | 1.1% |
| Interquartile 75% (IQ3) | 2.8% | 2.6% |
| Interquartile Range (IQR) | 0.70% | 1.5% |
| Standard Deviation (Sample) | 1.1% | 1.1% |
| Standard Deviation (Population) | 1.1% | 1.1% |
Similar Demographics by Single Father Households
Demographics Similar to Immigrants from Afghanistan by Single Father Households
In terms of single father households, the demographic groups most similar to Immigrants from Afghanistan are Korean (2.4%, a difference of 0.0%), Ecuadorian (2.4%, a difference of 0.030%), French Canadian (2.4%, a difference of 0.050%), German Russian (2.4%, a difference of 0.15%), and White/Caucasian (2.4%, a difference of 0.16%).
| Demographics | Rating | Rank | Single Father Households |
| Scandinavians | 27.4 /100 | #198 | Fair 2.4% |
| Immigrants | Vietnam | 27.1 /100 | #199 | Fair 2.4% |
| Peruvians | 27.1 /100 | #200 | Fair 2.4% |
| Immigrants | Uganda | 26.0 /100 | #201 | Fair 2.4% |
| German Russians | 25.7 /100 | #202 | Fair 2.4% |
| French Canadians | 24.7 /100 | #203 | Fair 2.4% |
| Ecuadorians | 24.5 /100 | #204 | Fair 2.4% |
| Immigrants | Afghanistan | 24.2 /100 | #205 | Fair 2.4% |
| Koreans | 24.1 /100 | #206 | Fair 2.4% |
| Whites/Caucasians | 22.6 /100 | #207 | Fair 2.4% |
| Immigrants | Kenya | 20.3 /100 | #208 | Fair 2.4% |
| Immigrants | Peru | 19.3 /100 | #209 | Poor 2.4% |
| Immigrants | Costa Rica | 19.2 /100 | #210 | Poor 2.4% |
| Immigrants | Nigeria | 18.7 /100 | #211 | Poor 2.4% |
| Finns | 18.3 /100 | #212 | Poor 2.4% |
Demographics Similar to Paraguayans by Single Father Households
In terms of single father households, the demographic groups most similar to Paraguayans are Mongolian (2.1%, a difference of 0.030%), Maltese (2.0%, a difference of 0.17%), Immigrants from Western Asia (2.1%, a difference of 0.36%), Immigrants from Malaysia (2.0%, a difference of 0.37%), and Immigrants from Italy (2.1%, a difference of 0.41%).
| Demographics | Rating | Rank | Single Father Households |
| Immigrants | Czechoslovakia | 99.9 /100 | #58 | Exceptional 2.0% |
| Immigrants | North Macedonia | 99.9 /100 | #59 | Exceptional 2.0% |
| Immigrants | Austria | 99.9 /100 | #60 | Exceptional 2.0% |
| Vietnamese | 99.9 /100 | #61 | Exceptional 2.0% |
| Immigrants | Malaysia | 99.9 /100 | #62 | Exceptional 2.0% |
| Maltese | 99.9 /100 | #63 | Exceptional 2.0% |
| Mongolians | 99.9 /100 | #64 | Exceptional 2.1% |
| Paraguayans | 99.9 /100 | #65 | Exceptional 2.1% |
| Immigrants | Western Asia | 99.8 /100 | #66 | Exceptional 2.1% |
| Immigrants | Italy | 99.8 /100 | #67 | Exceptional 2.1% |
| Immigrants | Denmark | 99.8 /100 | #68 | Exceptional 2.1% |
| Immigrants | Romania | 99.8 /100 | #69 | Exceptional 2.1% |
| Egyptians | 99.8 /100 | #70 | Exceptional 2.1% |
| Immigrants | Kuwait | 99.8 /100 | #71 | Exceptional 2.1% |
| Immigrants | Spain | 99.8 /100 | #72 | Exceptional 2.1% |