Yaqui vs Immigrants from the Azores High School Diploma
COMPARE
Yaqui
Immigrants from the Azores
High School Diploma
High School Diploma Comparison
Yaqui
Immigrants from the Azores
84.7%
HIGH SCHOOL DIPLOMA
0.0/ 100
METRIC RATING
314th/ 347
METRIC RANK
82.8%
HIGH SCHOOL DIPLOMA
0.0/ 100
METRIC RATING
330th/ 347
METRIC RANK
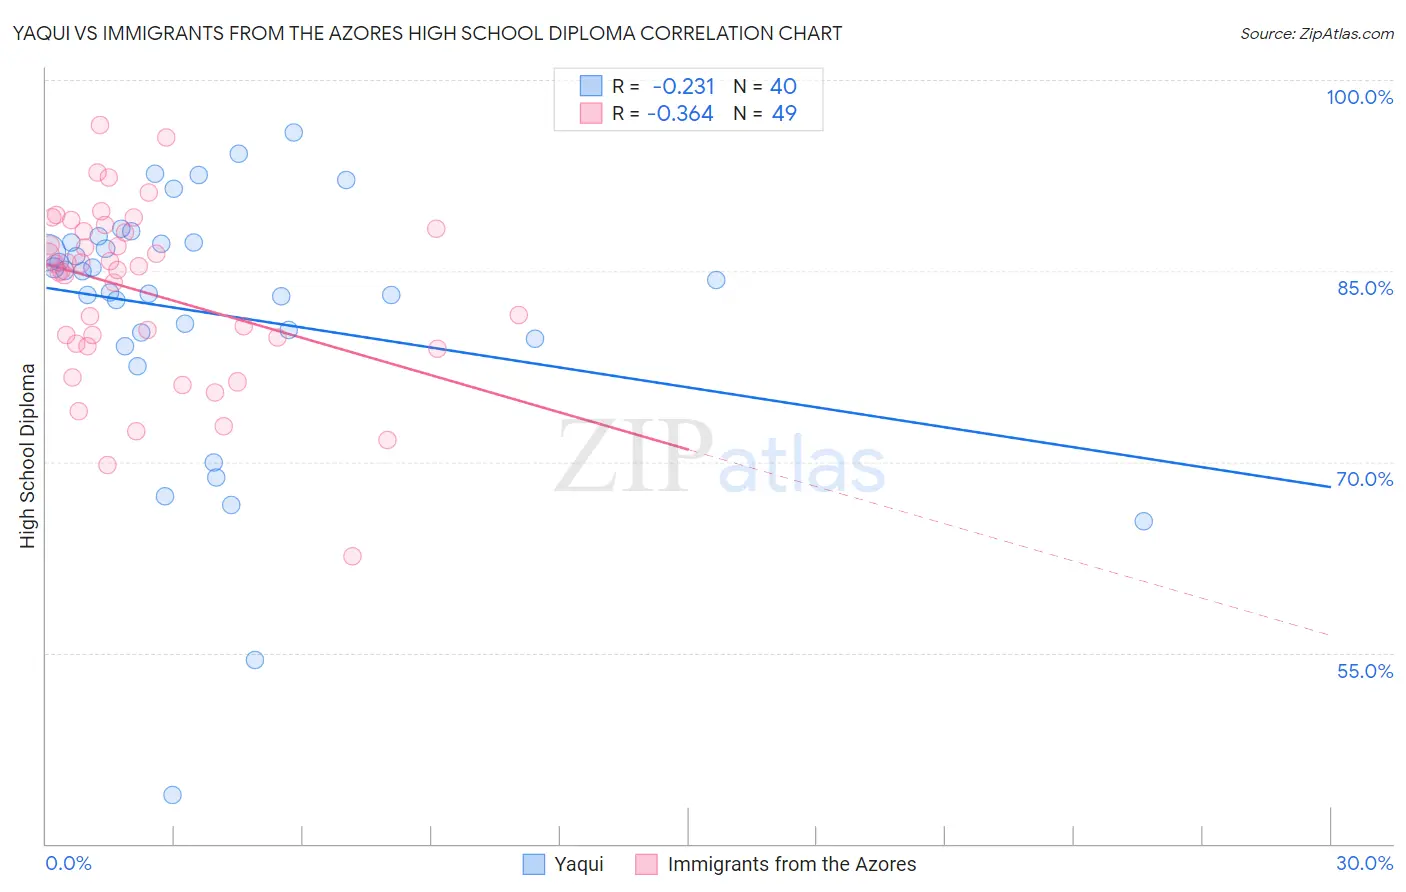
Yaqui vs Immigrants from the Azores High School Diploma Correlation Chart
The statistical analysis conducted on geographies consisting of 107,732,380 people shows a weak negative correlation between the proportion of Yaqui and percentage of population with at least high school diploma education in the United States with a correlation coefficient (R) of -0.231 and weighted average of 84.7%. Similarly, the statistical analysis conducted on geographies consisting of 46,257,310 people shows a mild negative correlation between the proportion of Immigrants from the Azores and percentage of population with at least high school diploma education in the United States with a correlation coefficient (R) of -0.364 and weighted average of 82.8%, a difference of 2.4%.
High School Diploma Correlation Summary
| Measurement | Yaqui | Immigrants from the Azores |
| Minimum | 43.8% | 62.6% |
| Maximum | 95.8% | 96.5% |
| Range | 52.1% | 33.8% |
| Mean | 81.7% | 83.3% |
| Median | 84.6% | 85.1% |
| Interquartile 25% (IQ1) | 79.9% | 79.2% |
| Interquartile 75% (IQ3) | 87.3% | 88.2% |
| Interquartile Range (IQR) | 7.3% | 9.0% |
| Standard Deviation (Sample) | 10.6% | 6.9% |
| Standard Deviation (Population) | 10.5% | 6.9% |
Demographics Similar to Yaqui and Immigrants from the Azores by High School Diploma
In terms of high school diploma, the demographic groups most similar to Yaqui are Puerto Rican (84.7%, a difference of 0.10%), Immigrants from Ecuador (84.8%, a difference of 0.11%), Cape Verdean (85.1%, a difference of 0.37%), Belizean (84.3%, a difference of 0.50%), and Immigrants from Caribbean (84.3%, a difference of 0.56%). Similarly, the demographic groups most similar to Immigrants from the Azores are Hispanic or Latino (82.9%, a difference of 0.080%), Dominican (82.9%, a difference of 0.17%), Honduran (83.0%, a difference of 0.22%), Mexican American Indian (83.0%, a difference of 0.26%), and Central American (82.5%, a difference of 0.31%).
| Demographics | Rating | Rank | High School Diploma |
| Cape Verdeans | 0.0 /100 | #312 | Tragic 85.1% |
| Immigrants | Ecuador | 0.0 /100 | #313 | Tragic 84.8% |
| Yaqui | 0.0 /100 | #314 | Tragic 84.7% |
| Puerto Ricans | 0.0 /100 | #315 | Tragic 84.7% |
| Belizeans | 0.0 /100 | #316 | Tragic 84.3% |
| Immigrants | Caribbean | 0.0 /100 | #317 | Tragic 84.3% |
| Immigrants | Belize | 0.0 /100 | #318 | Tragic 84.2% |
| Central American Indians | 0.0 /100 | #319 | Tragic 84.2% |
| Nicaraguans | 0.0 /100 | #320 | Tragic 84.1% |
| Yuman | 0.0 /100 | #321 | Tragic 84.0% |
| Lumbee | 0.0 /100 | #322 | Tragic 83.6% |
| Immigrants | Cuba | 0.0 /100 | #323 | Tragic 83.5% |
| Immigrants | Cabo Verde | 0.0 /100 | #324 | Tragic 83.3% |
| Immigrants | Nicaragua | 0.0 /100 | #325 | Tragic 83.1% |
| Mexican American Indians | 0.0 /100 | #326 | Tragic 83.0% |
| Hondurans | 0.0 /100 | #327 | Tragic 83.0% |
| Dominicans | 0.0 /100 | #328 | Tragic 82.9% |
| Hispanics or Latinos | 0.0 /100 | #329 | Tragic 82.9% |
| Immigrants | Azores | 0.0 /100 | #330 | Tragic 82.8% |
| Central Americans | 0.0 /100 | #331 | Tragic 82.5% |
| Immigrants | Honduras | 0.0 /100 | #332 | Tragic 82.5% |