Alaska Native vs Immigrants from West Indies Births to Unmarried Women
COMPARE
Alaska Native
Immigrants from West Indies
Births to Unmarried Women
Births to Unmarried Women Comparison
Alaska Natives
Immigrants from West Indies
38.3%
BIRTHS TO UNMARRIED WOMEN
0.0/ 100
METRIC RATING
296th/ 347
METRIC RANK
38.6%
BIRTHS TO UNMARRIED WOMEN
0.0/ 100
METRIC RATING
300th/ 347
METRIC RANK
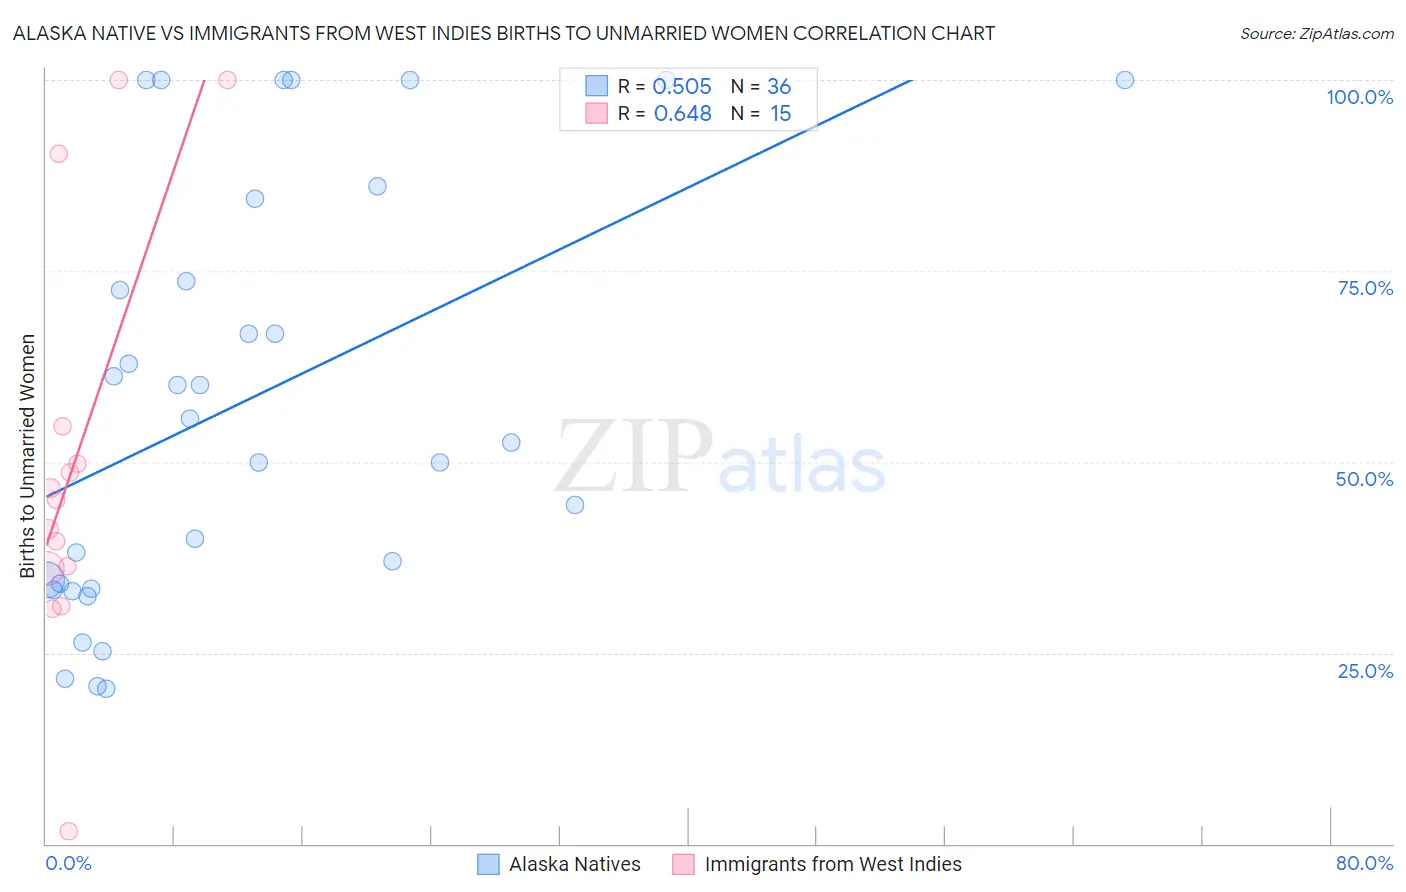
Alaska Native vs Immigrants from West Indies Births to Unmarried Women Correlation Chart
The statistical analysis conducted on geographies consisting of 75,658,541 people shows a substantial positive correlation between the proportion of Alaska Natives and percentage of births to unmarried women in the United States with a correlation coefficient (R) of 0.505 and weighted average of 38.3%. Similarly, the statistical analysis conducted on geographies consisting of 71,872,007 people shows a significant positive correlation between the proportion of Immigrants from West Indies and percentage of births to unmarried women in the United States with a correlation coefficient (R) of 0.648 and weighted average of 38.6%, a difference of 0.74%.
Births to Unmarried Women Correlation Summary
| Measurement | Alaska Native | Immigrants from West Indies |
| Minimum | 20.3% | 1.6% |
| Maximum | 100.0% | 100.0% |
| Range | 79.7% | 98.4% |
| Mean | 57.7% | 50.1% |
| Median | 54.1% | 44.9% |
| Interquartile 25% (IQ1) | 33.8% | 36.0% |
| Interquartile 75% (IQ3) | 79.0% | 54.6% |
| Interquartile Range (IQR) | 45.3% | 18.6% |
| Standard Deviation (Sample) | 27.2% | 27.2% |
| Standard Deviation (Population) | 26.8% | 26.2% |
Demographics Similar to Alaska Natives and Immigrants from West Indies by Births to Unmarried Women
In terms of births to unmarried women, the demographic groups most similar to Alaska Natives are Iroquois (38.2%, a difference of 0.24%), Dutch West Indian (38.4%, a difference of 0.28%), Jamaican (38.5%, a difference of 0.48%), Spanish American (38.6%, a difference of 0.68%), and Haitian (38.6%, a difference of 0.75%). Similarly, the demographic groups most similar to Immigrants from West Indies are Haitian (38.6%, a difference of 0.010%), Spanish American (38.6%, a difference of 0.060%), Honduran (38.7%, a difference of 0.25%), Jamaican (38.5%, a difference of 0.26%), and Dutch West Indian (38.4%, a difference of 0.46%).
| Demographics | Rating | Rank | Births to Unmarried Women |
| Immigrants | Liberia | 0.0 /100 | #288 | Tragic 37.6% |
| Alaskan Athabascans | 0.0 /100 | #289 | Tragic 37.7% |
| Hispanics or Latinos | 0.0 /100 | #290 | Tragic 37.8% |
| Seminole | 0.0 /100 | #291 | Tragic 37.9% |
| Blackfeet | 0.0 /100 | #292 | Tragic 37.9% |
| Immigrants | Nicaragua | 0.0 /100 | #293 | Tragic 38.0% |
| British West Indians | 0.0 /100 | #294 | Tragic 38.0% |
| Iroquois | 0.0 /100 | #295 | Tragic 38.2% |
| Alaska Natives | 0.0 /100 | #296 | Tragic 38.3% |
| Dutch West Indians | 0.0 /100 | #297 | Tragic 38.4% |
| Jamaicans | 0.0 /100 | #298 | Tragic 38.5% |
| Spanish Americans | 0.0 /100 | #299 | Tragic 38.6% |
| Immigrants | West Indies | 0.0 /100 | #300 | Tragic 38.6% |
| Haitians | 0.0 /100 | #301 | Tragic 38.6% |
| Hondurans | 0.0 /100 | #302 | Tragic 38.7% |
| Immigrants | Jamaica | 0.0 /100 | #303 | Tragic 38.8% |
| Yaqui | 0.0 /100 | #304 | Tragic 38.8% |
| Immigrants | Haiti | 0.0 /100 | #305 | Tragic 38.9% |
| Central American Indians | 0.0 /100 | #306 | Tragic 39.0% |
| Immigrants | Honduras | 0.0 /100 | #307 | Tragic 39.3% |
| Aleuts | 0.0 /100 | #308 | Tragic 39.3% |