Immigrants from Australia vs Immigrants from South Africa Average Family Size
COMPARE
Immigrants from Australia
Immigrants from South Africa
Average Family Size
Average Family Size Comparison
Immigrants from Australia
Immigrants from South Africa
3.13
AVERAGE FAMILY SIZE
0.1/ 100
METRIC RATING
312th/ 347
METRIC RANK
3.16
AVERAGE FAMILY SIZE
0.9/ 100
METRIC RATING
265th/ 347
METRIC RANK
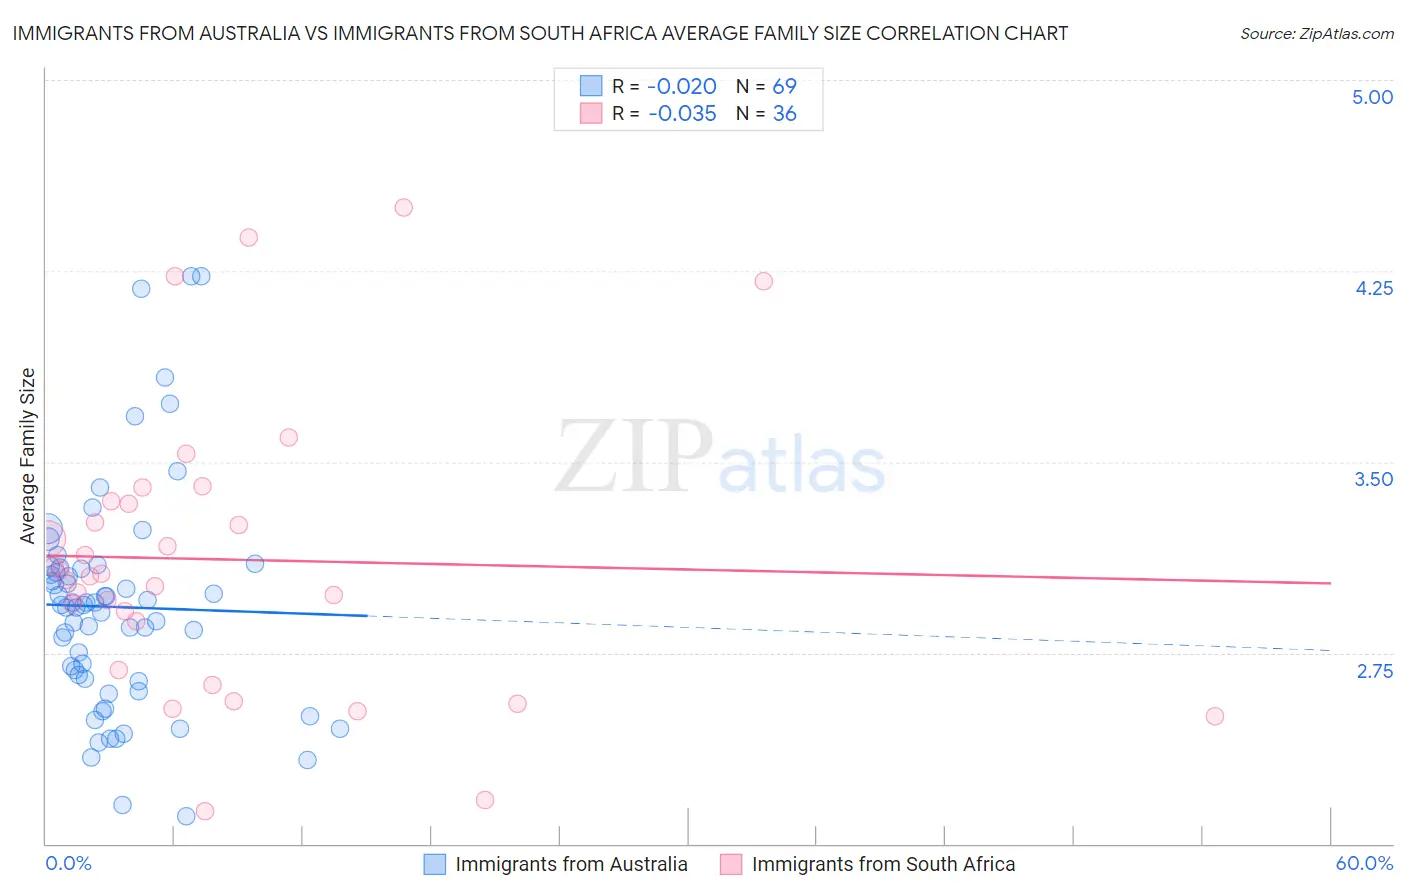
Immigrants from Australia vs Immigrants from South Africa Average Family Size Correlation Chart
The statistical analysis conducted on geographies consisting of 227,146,773 people shows no correlation between the proportion of Immigrants from Australia and average family size in the United States with a correlation coefficient (R) of -0.020 and weighted average of 3.13. Similarly, the statistical analysis conducted on geographies consisting of 233,270,414 people shows no correlation between the proportion of Immigrants from South Africa and average family size in the United States with a correlation coefficient (R) of -0.035 and weighted average of 3.16, a difference of 1.1%.
Average Family Size Correlation Summary
| Measurement | Immigrants from Australia | Immigrants from South Africa |
| Minimum | 2.11 | 2.13 |
| Maximum | 4.23 | 4.50 |
| Range | 2.12 | 2.37 |
| Mean | 2.93 | 3.12 |
| Median | 2.94 | 3.06 |
| Interquartile 25% (IQ1) | 2.64 | 2.78 |
| Interquartile 75% (IQ3) | 3.08 | 3.34 |
| Interquartile Range (IQR) | 0.44 | 0.56 |
| Standard Deviation (Sample) | 0.44 | 0.56 |
| Standard Deviation (Population) | 0.44 | 0.55 |
Similar Demographics by Average Family Size
Demographics Similar to Immigrants from Australia by Average Family Size
In terms of average family size, the demographic groups most similar to Immigrants from Australia are Bulgarian (3.13, a difference of 0.0%), Immigrants from Northern Europe (3.13, a difference of 0.020%), Russian (3.12, a difference of 0.050%), Czechoslovakian (3.13, a difference of 0.060%), and Immigrants from Scotland (3.12, a difference of 0.060%).
| Demographics | Rating | Rank | Average Family Size |
| Australians | 0.1 /100 | #305 | Tragic 3.13 |
| Immigrants | Ireland | 0.1 /100 | #306 | Tragic 3.13 |
| Immigrants | Serbia | 0.1 /100 | #307 | Tragic 3.13 |
| Slavs | 0.1 /100 | #308 | Tragic 3.13 |
| Northern Europeans | 0.1 /100 | #309 | Tragic 3.13 |
| Czechoslovakians | 0.1 /100 | #310 | Tragic 3.13 |
| Immigrants | Northern Europe | 0.1 /100 | #311 | Tragic 3.13 |
| Immigrants | Australia | 0.1 /100 | #312 | Tragic 3.13 |
| Bulgarians | 0.1 /100 | #313 | Tragic 3.13 |
| Russians | 0.1 /100 | #314 | Tragic 3.12 |
| Immigrants | Scotland | 0.1 /100 | #315 | Tragic 3.12 |
| Serbians | 0.1 /100 | #316 | Tragic 3.12 |
| Italians | 0.1 /100 | #317 | Tragic 3.12 |
| Eastern Europeans | 0.1 /100 | #318 | Tragic 3.12 |
| Welsh | 0.1 /100 | #319 | Tragic 3.12 |
Demographics Similar to Immigrants from South Africa by Average Family Size
In terms of average family size, the demographic groups most similar to Immigrants from South Africa are Immigrants from Greece (3.16, a difference of 0.010%), Iroquois (3.16, a difference of 0.030%), American (3.16, a difference of 0.050%), Immigrants from Bulgaria (3.16, a difference of 0.070%), and Maltese (3.16, a difference of 0.080%).
| Demographics | Rating | Rank | Average Family Size |
| Turks | 1.3 /100 | #258 | Tragic 3.16 |
| Potawatomi | 1.3 /100 | #259 | Tragic 3.16 |
| Immigrants | Albania | 1.3 /100 | #260 | Tragic 3.16 |
| Immigrants | North Macedonia | 1.3 /100 | #261 | Tragic 3.16 |
| Immigrants | Russia | 1.3 /100 | #262 | Tragic 3.16 |
| Immigrants | Bulgaria | 1.0 /100 | #263 | Tragic 3.16 |
| Americans | 1.0 /100 | #264 | Tragic 3.16 |
| Immigrants | South Africa | 0.9 /100 | #265 | Tragic 3.16 |
| Immigrants | Greece | 0.9 /100 | #266 | Tragic 3.16 |
| Iroquois | 0.8 /100 | #267 | Tragic 3.16 |
| Maltese | 0.8 /100 | #268 | Tragic 3.16 |
| Immigrants | Singapore | 0.7 /100 | #269 | Tragic 3.16 |
| Tlingit-Haida | 0.7 /100 | #270 | Tragic 3.16 |
| Immigrants | Germany | 0.7 /100 | #271 | Tragic 3.15 |
| Immigrants | Lithuania | 0.6 /100 | #272 | Tragic 3.15 |