Yakama vs Immigrants from Northern Europe Unemployment Among Ages 65 to 74 years
COMPARE
Yakama
Immigrants from Northern Europe
Unemployment Among Ages 65 to 74 years
Unemployment Among Ages 65 to 74 years Comparison
Yakama
Immigrants from Northern Europe
6.6%
UNEMPLOYMENT AMONG AGES 65 TO 74 YEARS
0.0/ 100
METRIC RATING
339th/ 347
METRIC RANK
5.4%
UNEMPLOYMENT AMONG AGES 65 TO 74 YEARS
51.1/ 100
METRIC RATING
173rd/ 347
METRIC RANK
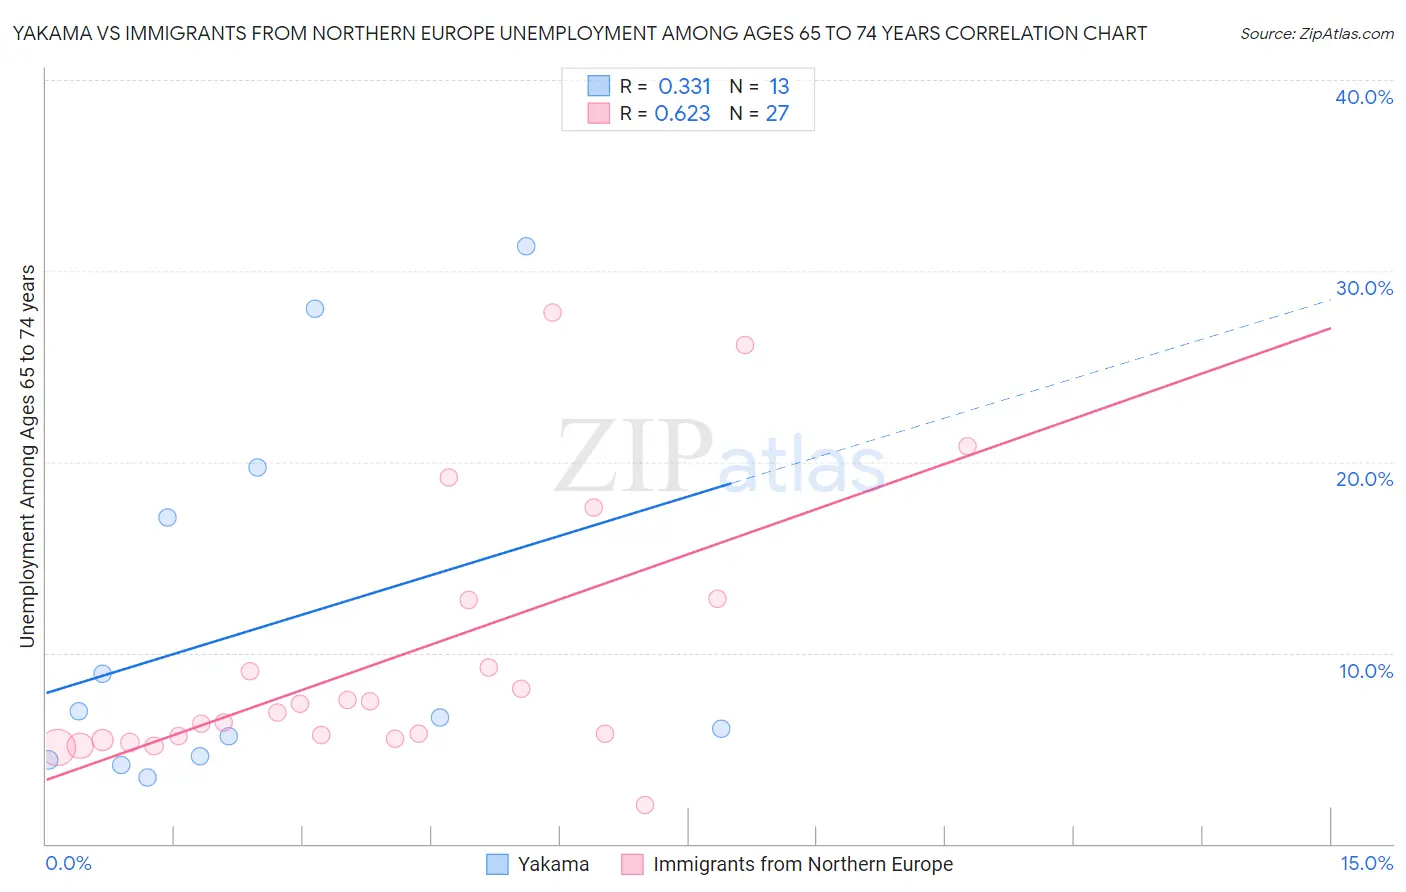
Yakama vs Immigrants from Northern Europe Unemployment Among Ages 65 to 74 years Correlation Chart
The statistical analysis conducted on geographies consisting of 18,534,665 people shows a mild positive correlation between the proportion of Yakama and unemployment rate among population between the ages 65 and 74 in the United States with a correlation coefficient (R) of 0.331 and weighted average of 6.6%. Similarly, the statistical analysis conducted on geographies consisting of 403,648,528 people shows a significant positive correlation between the proportion of Immigrants from Northern Europe and unemployment rate among population between the ages 65 and 74 in the United States with a correlation coefficient (R) of 0.623 and weighted average of 5.4%, a difference of 22.3%.
Unemployment Among Ages 65 to 74 years Correlation Summary
| Measurement | Yakama | Immigrants from Northern Europe |
| Minimum | 3.5% | 2.0% |
| Maximum | 31.3% | 27.8% |
| Range | 27.8% | 25.8% |
| Mean | 11.3% | 9.7% |
| Median | 6.6% | 6.9% |
| Interquartile 25% (IQ1) | 4.5% | 5.5% |
| Interquartile 75% (IQ3) | 18.4% | 12.8% |
| Interquartile Range (IQR) | 13.9% | 7.3% |
| Standard Deviation (Sample) | 9.6% | 6.7% |
| Standard Deviation (Population) | 9.2% | 6.6% |
Similar Demographics by Unemployment Among Ages 65 to 74 years
Demographics Similar to Yakama by Unemployment Among Ages 65 to 74 years
In terms of unemployment among ages 65 to 74 years, the demographic groups most similar to Yakama are Tlingit-Haida (6.5%, a difference of 0.36%), Ute (6.5%, a difference of 0.46%), Pima (6.6%, a difference of 0.84%), Immigrants from Armenia (6.5%, a difference of 1.2%), and Puerto Rican (6.4%, a difference of 2.8%).
| Demographics | Rating | Rank | Unemployment Among Ages 65 to 74 years |
| Immigrants | Dominican Republic | 0.0 /100 | #332 | Tragic 6.3% |
| Paiute | 0.0 /100 | #333 | Tragic 6.3% |
| Taiwanese | 0.0 /100 | #334 | Tragic 6.3% |
| Puerto Ricans | 0.0 /100 | #335 | Tragic 6.4% |
| Immigrants | Armenia | 0.0 /100 | #336 | Tragic 6.5% |
| Ute | 0.0 /100 | #337 | Tragic 6.5% |
| Tlingit-Haida | 0.0 /100 | #338 | Tragic 6.5% |
| Yakama | 0.0 /100 | #339 | Tragic 6.6% |
| Pima | 0.0 /100 | #340 | Tragic 6.6% |
| Alaska Natives | 0.0 /100 | #341 | Tragic 6.8% |
| Navajo | 0.0 /100 | #342 | Tragic 6.9% |
| Alaskan Athabascans | 0.0 /100 | #343 | Tragic 7.4% |
| Inupiat | 0.0 /100 | #344 | Tragic 7.5% |
| Immigrants | Yemen | 0.0 /100 | #345 | Tragic 8.3% |
| Yup'ik | 0.0 /100 | #346 | Tragic 9.5% |
Demographics Similar to Immigrants from Northern Europe by Unemployment Among Ages 65 to 74 years
In terms of unemployment among ages 65 to 74 years, the demographic groups most similar to Immigrants from Northern Europe are Greek (5.4%, a difference of 0.0%), Panamanian (5.4%, a difference of 0.020%), Potawatomi (5.4%, a difference of 0.040%), Immigrants from Iran (5.4%, a difference of 0.070%), and Syrian (5.4%, a difference of 0.090%).
| Demographics | Rating | Rank | Unemployment Among Ages 65 to 74 years |
| Slovaks | 60.0 /100 | #166 | Good 5.3% |
| Indians (Asian) | 59.9 /100 | #167 | Average 5.3% |
| Whites/Caucasians | 57.2 /100 | #168 | Average 5.4% |
| Laotians | 55.7 /100 | #169 | Average 5.4% |
| Syrians | 53.7 /100 | #170 | Average 5.4% |
| Panamanians | 51.8 /100 | #171 | Average 5.4% |
| Greeks | 51.1 /100 | #172 | Average 5.4% |
| Immigrants | Northern Europe | 51.1 /100 | #173 | Average 5.4% |
| Potawatomi | 50.0 /100 | #174 | Average 5.4% |
| Immigrants | Iran | 49.0 /100 | #175 | Average 5.4% |
| Immigrants | Western Europe | 47.3 /100 | #176 | Average 5.4% |
| Arabs | 46.8 /100 | #177 | Average 5.4% |
| French | 43.1 /100 | #178 | Average 5.4% |
| Guamanians/Chamorros | 42.1 /100 | #179 | Average 5.4% |
| Immigrants | Ireland | 42.0 /100 | #180 | Average 5.4% |