Ukrainian vs Puget Sound Salish Single Father Households
COMPARE
Ukrainian
Puget Sound Salish
Single Father Households
Single Father Households Comparison
Ukrainians
Puget Sound Salish
2.1%
SINGLE FATHER HOUSEHOLDS
99.3/ 100
METRIC RATING
94th/ 347
METRIC RANK
2.7%
SINGLE FATHER HOUSEHOLDS
0.0/ 100
METRIC RATING
290th/ 347
METRIC RANK
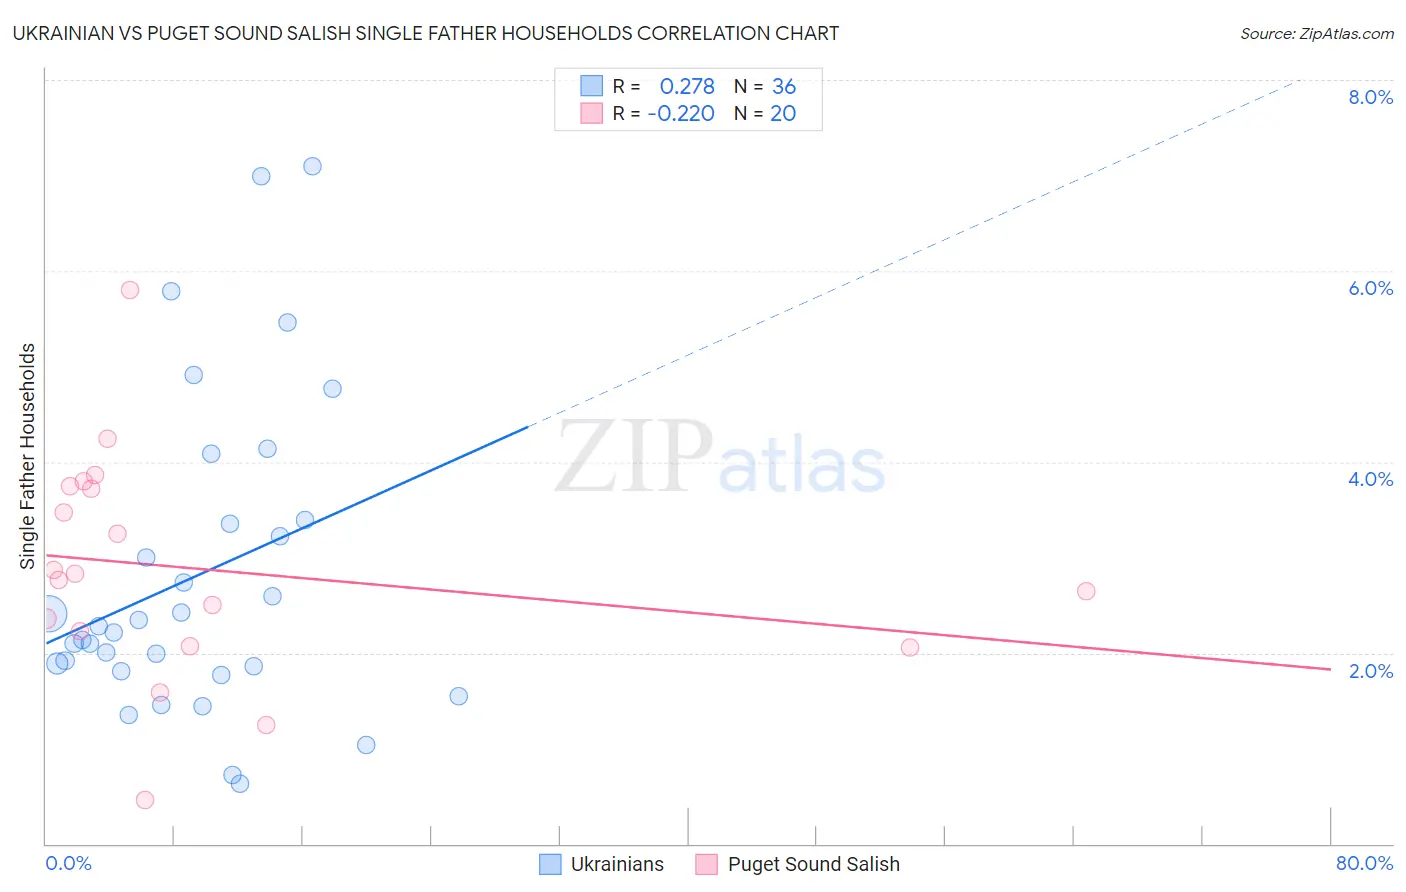
Ukrainian vs Puget Sound Salish Single Father Households Correlation Chart
The statistical analysis conducted on geographies consisting of 442,446,629 people shows a weak positive correlation between the proportion of Ukrainians and percentage of single father households in the United States with a correlation coefficient (R) of 0.278 and weighted average of 2.1%. Similarly, the statistical analysis conducted on geographies consisting of 46,042,522 people shows a weak negative correlation between the proportion of Puget Sound Salish and percentage of single father households in the United States with a correlation coefficient (R) of -0.220 and weighted average of 2.7%, a difference of 26.5%.
Single Father Households Correlation Summary
| Measurement | Ukrainian | Puget Sound Salish |
| Minimum | 0.63% | 0.46% |
| Maximum | 7.1% | 5.8% |
| Range | 6.5% | 5.3% |
| Mean | 2.8% | 2.9% |
| Median | 2.2% | 2.8% |
| Interquartile 25% (IQ1) | 1.8% | 2.2% |
| Interquartile 75% (IQ3) | 3.4% | 3.7% |
| Interquartile Range (IQR) | 1.5% | 1.6% |
| Standard Deviation (Sample) | 1.6% | 1.2% |
| Standard Deviation (Population) | 1.6% | 1.2% |
Similar Demographics by Single Father Households
Demographics Similar to Ukrainians by Single Father Households
In terms of single father households, the demographic groups most similar to Ukrainians are Croatian (2.1%, a difference of 0.0%), Romanian (2.1%, a difference of 0.11%), Immigrants from Guyana (2.1%, a difference of 0.20%), Bermudan (2.1%, a difference of 0.22%), and Arab (2.1%, a difference of 0.37%).
| Demographics | Rating | Rank | Single Father Households |
| Lithuanians | 99.5 /100 | #87 | Exceptional 2.1% |
| Bhutanese | 99.5 /100 | #88 | Exceptional 2.1% |
| Immigrants | Armenia | 99.5 /100 | #89 | Exceptional 2.1% |
| Immigrants | Pakistan | 99.5 /100 | #90 | Exceptional 2.1% |
| Immigrants | Guyana | 99.4 /100 | #91 | Exceptional 2.1% |
| Romanians | 99.4 /100 | #92 | Exceptional 2.1% |
| Croatians | 99.3 /100 | #93 | Exceptional 2.1% |
| Ukrainians | 99.3 /100 | #94 | Exceptional 2.1% |
| Bermudans | 99.2 /100 | #95 | Exceptional 2.1% |
| Arabs | 99.2 /100 | #96 | Exceptional 2.1% |
| Immigrants | Moldova | 99.1 /100 | #97 | Exceptional 2.1% |
| Guyanese | 99.1 /100 | #98 | Exceptional 2.1% |
| South Africans | 99.1 /100 | #99 | Exceptional 2.1% |
| Immigrants | Northern Africa | 99.0 /100 | #100 | Exceptional 2.1% |
| Immigrants | Western Europe | 98.9 /100 | #101 | Exceptional 2.1% |
Demographics Similar to Puget Sound Salish by Single Father Households
In terms of single father households, the demographic groups most similar to Puget Sound Salish are Tlingit-Haida (2.7%, a difference of 0.45%), Immigrants from Cambodia (2.7%, a difference of 0.52%), Blackfeet (2.7%, a difference of 0.56%), Central American Indian (2.7%, a difference of 0.77%), and Immigrants from Cuba (2.7%, a difference of 0.92%).
| Demographics | Rating | Rank | Single Father Households |
| Immigrants | Nicaragua | 0.1 /100 | #283 | Tragic 2.7% |
| Hawaiians | 0.1 /100 | #284 | Tragic 2.7% |
| Ottawa | 0.1 /100 | #285 | Tragic 2.7% |
| Immigrants | Cuba | 0.1 /100 | #286 | Tragic 2.7% |
| Central American Indians | 0.0 /100 | #287 | Tragic 2.7% |
| Immigrants | Cambodia | 0.0 /100 | #288 | Tragic 2.7% |
| Tlingit-Haida | 0.0 /100 | #289 | Tragic 2.7% |
| Puget Sound Salish | 0.0 /100 | #290 | Tragic 2.7% |
| Blackfeet | 0.0 /100 | #291 | Tragic 2.7% |
| Choctaw | 0.0 /100 | #292 | Tragic 2.7% |
| Immigrants | Fiji | 0.0 /100 | #293 | Tragic 2.7% |
| Malaysians | 0.0 /100 | #294 | Tragic 2.7% |
| Chickasaw | 0.0 /100 | #295 | Tragic 2.8% |
| Japanese | 0.0 /100 | #296 | Tragic 2.8% |
| Hondurans | 0.0 /100 | #297 | Tragic 2.8% |