Irish vs Puget Sound Salish Single Father Households
COMPARE
Irish
Puget Sound Salish
Single Father Households
Single Father Households Comparison
Irish
Puget Sound Salish
2.3%
SINGLE FATHER HOUSEHOLDS
72.1/ 100
METRIC RATING
163rd/ 347
METRIC RANK
2.7%
SINGLE FATHER HOUSEHOLDS
0.0/ 100
METRIC RATING
290th/ 347
METRIC RANK
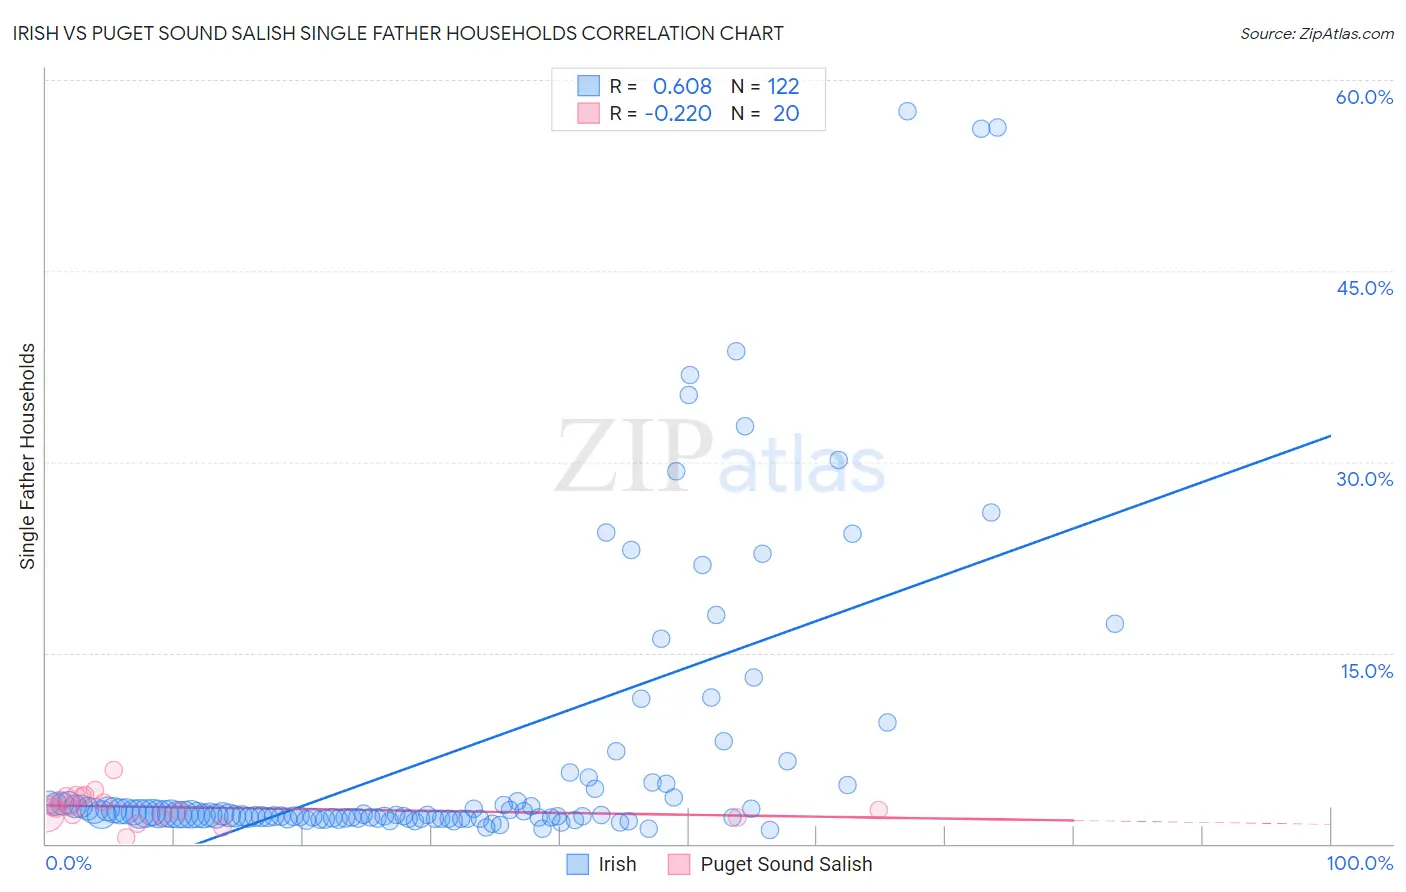
Irish vs Puget Sound Salish Single Father Households Correlation Chart
The statistical analysis conducted on geographies consisting of 562,350,400 people shows a significant positive correlation between the proportion of Irish and percentage of single father households in the United States with a correlation coefficient (R) of 0.608 and weighted average of 2.3%. Similarly, the statistical analysis conducted on geographies consisting of 46,042,522 people shows a weak negative correlation between the proportion of Puget Sound Salish and percentage of single father households in the United States with a correlation coefficient (R) of -0.220 and weighted average of 2.7%, a difference of 17.0%.
Single Father Households Correlation Summary
| Measurement | Irish | Puget Sound Salish |
| Minimum | 1.1% | 0.46% |
| Maximum | 57.5% | 5.8% |
| Range | 56.4% | 5.3% |
| Mean | 7.1% | 2.9% |
| Median | 2.3% | 2.8% |
| Interquartile 25% (IQ1) | 2.1% | 2.2% |
| Interquartile 75% (IQ3) | 4.3% | 3.7% |
| Interquartile Range (IQR) | 2.3% | 1.6% |
| Standard Deviation (Sample) | 11.5% | 1.2% |
| Standard Deviation (Population) | 11.4% | 1.2% |
Similar Demographics by Single Father Households
Demographics Similar to Irish by Single Father Households
In terms of single father households, the demographic groups most similar to Irish are Scottish (2.3%, a difference of 0.070%), Swiss (2.3%, a difference of 0.11%), Pakistani (2.3%, a difference of 0.14%), Scotch-Irish (2.3%, a difference of 0.24%), and English (2.3%, a difference of 0.31%).
| Demographics | Rating | Rank | Single Father Households |
| Immigrants | South America | 79.9 /100 | #156 | Good 2.3% |
| Canadians | 79.7 /100 | #157 | Good 2.3% |
| Immigrants | Senegal | 79.4 /100 | #158 | Good 2.3% |
| Immigrants | West Indies | 77.9 /100 | #159 | Good 2.3% |
| Immigrants | Bolivia | 76.3 /100 | #160 | Good 2.3% |
| Swiss | 73.2 /100 | #161 | Good 2.3% |
| Scottish | 72.8 /100 | #162 | Good 2.3% |
| Irish | 72.1 /100 | #163 | Good 2.3% |
| Pakistanis | 70.6 /100 | #164 | Good 2.3% |
| Scotch-Irish | 69.4 /100 | #165 | Good 2.3% |
| English | 68.6 /100 | #166 | Good 2.3% |
| South Americans | 64.3 /100 | #167 | Good 2.3% |
| Icelanders | 63.1 /100 | #168 | Good 2.3% |
| Czechs | 62.5 /100 | #169 | Good 2.3% |
| Ugandans | 62.2 /100 | #170 | Good 2.3% |
Demographics Similar to Puget Sound Salish by Single Father Households
In terms of single father households, the demographic groups most similar to Puget Sound Salish are Tlingit-Haida (2.7%, a difference of 0.45%), Immigrants from Cambodia (2.7%, a difference of 0.52%), Blackfeet (2.7%, a difference of 0.56%), Central American Indian (2.7%, a difference of 0.77%), and Immigrants from Cuba (2.7%, a difference of 0.92%).
| Demographics | Rating | Rank | Single Father Households |
| Immigrants | Nicaragua | 0.1 /100 | #283 | Tragic 2.7% |
| Hawaiians | 0.1 /100 | #284 | Tragic 2.7% |
| Ottawa | 0.1 /100 | #285 | Tragic 2.7% |
| Immigrants | Cuba | 0.1 /100 | #286 | Tragic 2.7% |
| Central American Indians | 0.0 /100 | #287 | Tragic 2.7% |
| Immigrants | Cambodia | 0.0 /100 | #288 | Tragic 2.7% |
| Tlingit-Haida | 0.0 /100 | #289 | Tragic 2.7% |
| Puget Sound Salish | 0.0 /100 | #290 | Tragic 2.7% |
| Blackfeet | 0.0 /100 | #291 | Tragic 2.7% |
| Choctaw | 0.0 /100 | #292 | Tragic 2.7% |
| Immigrants | Fiji | 0.0 /100 | #293 | Tragic 2.7% |
| Malaysians | 0.0 /100 | #294 | Tragic 2.7% |
| Chickasaw | 0.0 /100 | #295 | Tragic 2.8% |
| Japanese | 0.0 /100 | #296 | Tragic 2.8% |
| Hondurans | 0.0 /100 | #297 | Tragic 2.8% |