White/Caucasian vs Moroccan Currently Married
COMPARE
White/Caucasian
Moroccan
Currently Married
Currently Married Comparison
Whites/Caucasians
Moroccans
48.6%
CURRENTLY MARRIED
99.0/ 100
METRIC RATING
51st/ 347
METRIC RANK
44.6%
CURRENTLY MARRIED
0.9/ 100
METRIC RATING
238th/ 347
METRIC RANK
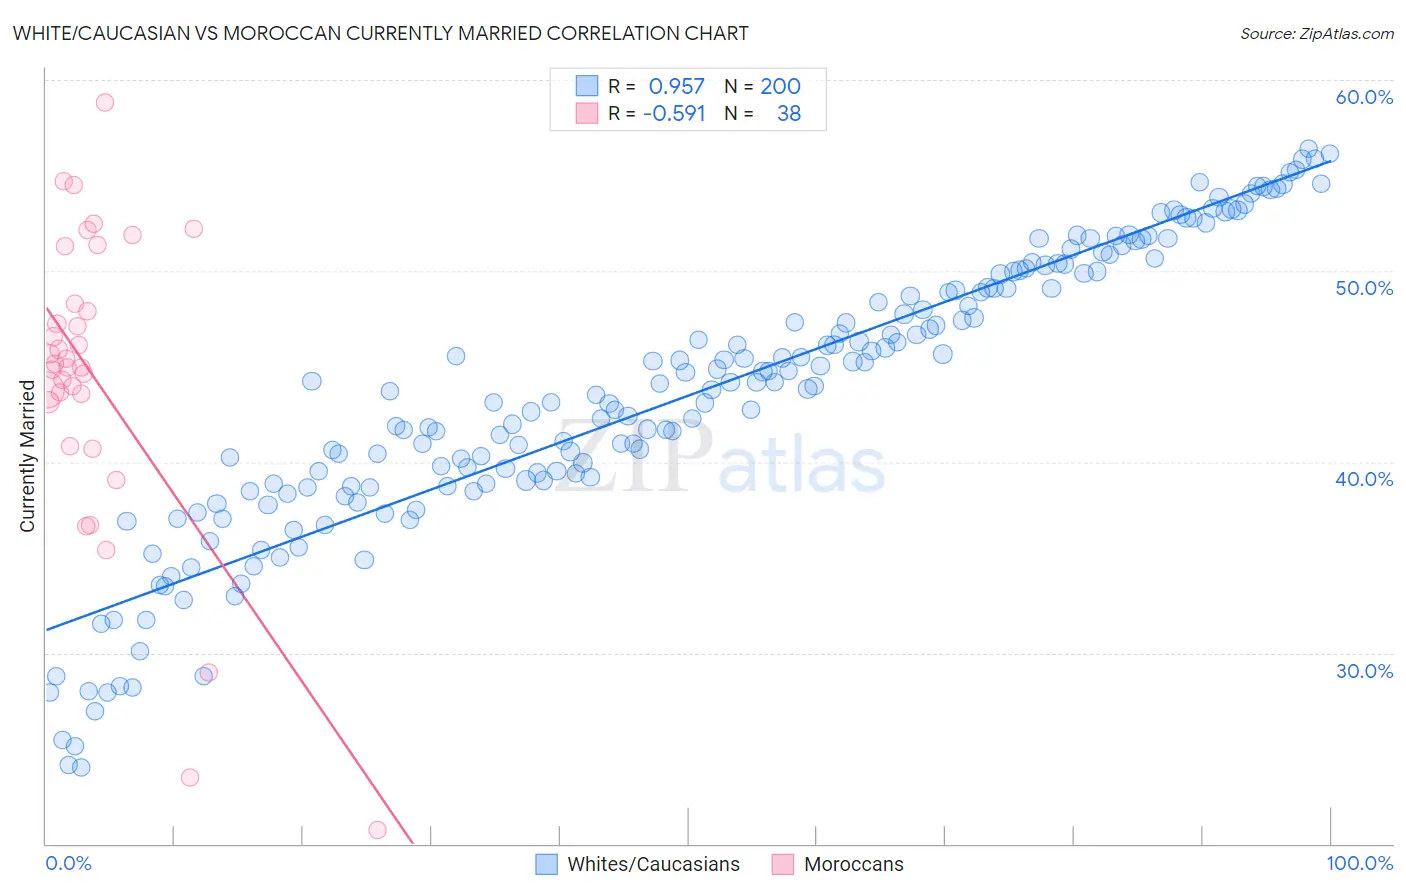
White/Caucasian vs Moroccan Currently Married Correlation Chart
The statistical analysis conducted on geographies consisting of 585,061,010 people shows a perfect positive correlation between the proportion of Whites/Caucasians and percentage of population currently married in the United States with a correlation coefficient (R) of 0.957 and weighted average of 48.6%. Similarly, the statistical analysis conducted on geographies consisting of 201,812,139 people shows a substantial negative correlation between the proportion of Moroccans and percentage of population currently married in the United States with a correlation coefficient (R) of -0.591 and weighted average of 44.6%, a difference of 8.9%.
Currently Married Correlation Summary
| Measurement | White/Caucasian | Moroccan |
| Minimum | 24.0% | 20.7% |
| Maximum | 56.4% | 58.8% |
| Range | 32.4% | 38.1% |
| Mean | 43.5% | 44.4% |
| Median | 44.0% | 45.0% |
| Interquartile 25% (IQ1) | 38.8% | 43.1% |
| Interquartile 75% (IQ3) | 49.5% | 48.3% |
| Interquartile Range (IQR) | 10.7% | 5.2% |
| Standard Deviation (Sample) | 7.4% | 7.9% |
| Standard Deviation (Population) | 7.4% | 7.8% |
Similar Demographics by Currently Married
Demographics Similar to Whites/Caucasians by Currently Married
In terms of currently married, the demographic groups most similar to Whites/Caucasians are Iranian (48.6%, a difference of 0.010%), Bhutanese (48.6%, a difference of 0.070%), Russian (48.6%, a difference of 0.090%), Austrian (48.7%, a difference of 0.20%), and Immigrants from Austria (48.5%, a difference of 0.20%).
| Demographics | Rating | Rank | Currently Married |
| Immigrants | North America | 99.3 /100 | #44 | Exceptional 48.7% |
| Belgians | 99.3 /100 | #45 | Exceptional 48.7% |
| Immigrants | Iran | 99.2 /100 | #46 | Exceptional 48.7% |
| Northern Europeans | 99.2 /100 | #47 | Exceptional 48.7% |
| Austrians | 99.2 /100 | #48 | Exceptional 48.7% |
| Bhutanese | 99.1 /100 | #49 | Exceptional 48.6% |
| Iranians | 99.0 /100 | #50 | Exceptional 48.6% |
| Whites/Caucasians | 99.0 /100 | #51 | Exceptional 48.6% |
| Russians | 98.9 /100 | #52 | Exceptional 48.6% |
| Immigrants | Austria | 98.8 /100 | #53 | Exceptional 48.5% |
| Immigrants | Moldova | 98.7 /100 | #54 | Exceptional 48.5% |
| Immigrants | North Macedonia | 98.7 /100 | #55 | Exceptional 48.5% |
| Latvians | 98.7 /100 | #56 | Exceptional 48.5% |
| Immigrants | Netherlands | 98.6 /100 | #57 | Exceptional 48.5% |
| French | 98.6 /100 | #58 | Exceptional 48.4% |
Demographics Similar to Moroccans by Currently Married
In terms of currently married, the demographic groups most similar to Moroccans are Cuban (44.6%, a difference of 0.080%), Seminole (44.6%, a difference of 0.080%), Alaskan Athabascan (44.6%, a difference of 0.090%), Immigrants from Mexico (44.5%, a difference of 0.14%), and Mexican American Indian (44.5%, a difference of 0.14%).
| Demographics | Rating | Rank | Currently Married |
| Immigrants | Panama | 1.5 /100 | #231 | Tragic 44.9% |
| Nepalese | 1.2 /100 | #232 | Tragic 44.7% |
| Immigrants | Saudi Arabia | 1.1 /100 | #233 | Tragic 44.7% |
| Iroquois | 1.1 /100 | #234 | Tragic 44.7% |
| Alaskan Athabascans | 0.9 /100 | #235 | Tragic 44.6% |
| Cubans | 0.9 /100 | #236 | Tragic 44.6% |
| Seminole | 0.9 /100 | #237 | Tragic 44.6% |
| Moroccans | 0.9 /100 | #238 | Tragic 44.6% |
| Immigrants | Mexico | 0.7 /100 | #239 | Tragic 44.5% |
| Mexican American Indians | 0.7 /100 | #240 | Tragic 44.5% |
| Ethiopians | 0.7 /100 | #241 | Tragic 44.5% |
| Immigrants | Cambodia | 0.7 /100 | #242 | Tragic 44.5% |
| Immigrants | Ethiopia | 0.7 /100 | #243 | Tragic 44.5% |
| Japanese | 0.6 /100 | #244 | Tragic 44.5% |
| Immigrants | Armenia | 0.4 /100 | #245 | Tragic 44.3% |