White/Caucasian vs Immigrants from Nigeria 4th Grade
COMPARE
White/Caucasian
Immigrants from Nigeria
4th Grade
4th Grade Comparison
Whites/Caucasians
Immigrants from Nigeria
98.1%
4TH GRADE
99.8/ 100
METRIC RATING
55th/ 347
METRIC RANK
97.0%
4TH GRADE
0.3/ 100
METRIC RATING
267th/ 347
METRIC RANK
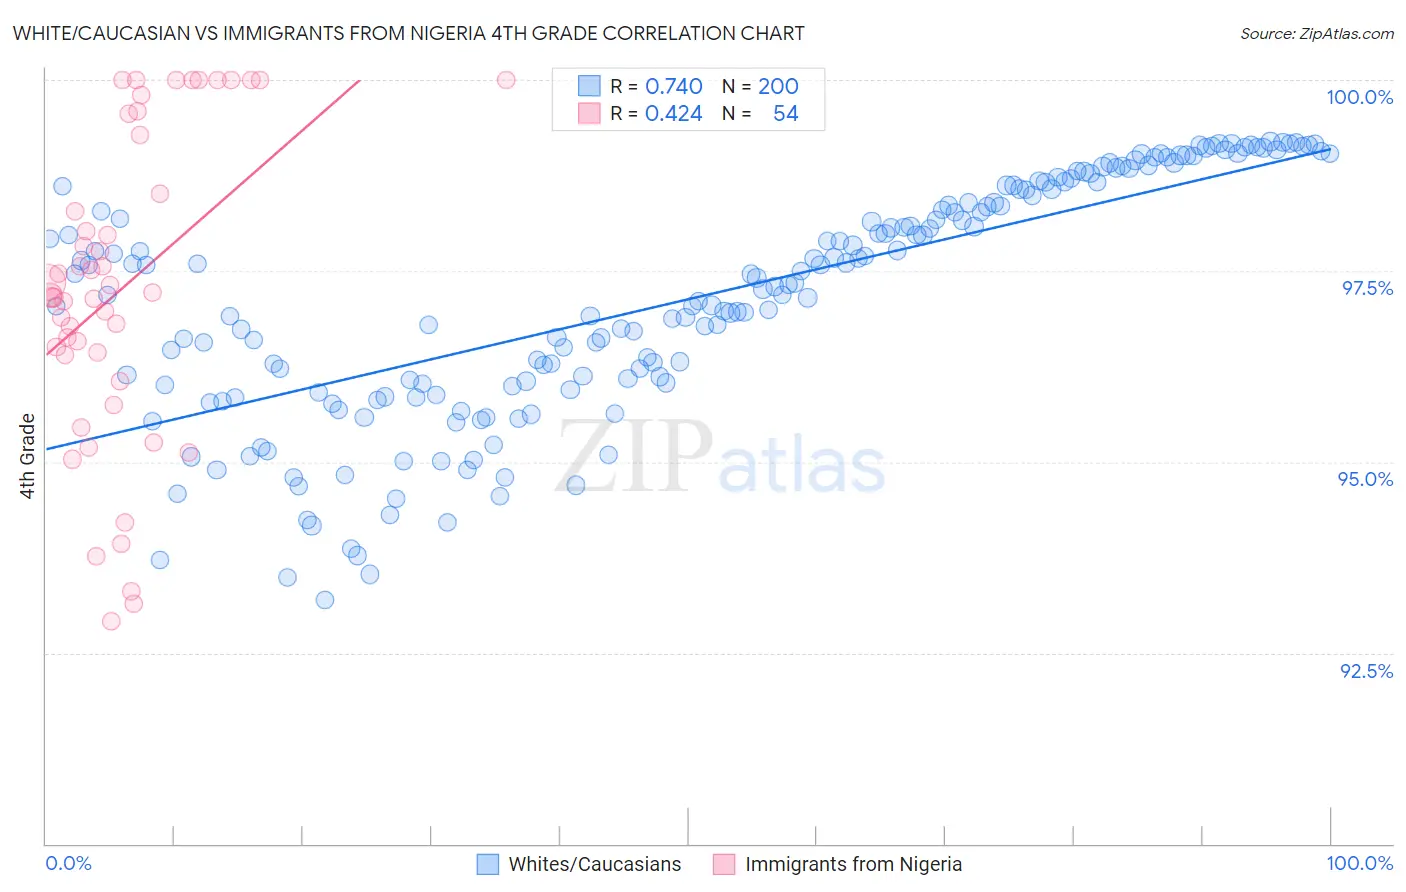
White/Caucasian vs Immigrants from Nigeria 4th Grade Correlation Chart
The statistical analysis conducted on geographies consisting of 585,247,315 people shows a strong positive correlation between the proportion of Whites/Caucasians and percentage of population with at least 4th grade education in the United States with a correlation coefficient (R) of 0.740 and weighted average of 98.1%. Similarly, the statistical analysis conducted on geographies consisting of 283,430,369 people shows a moderate positive correlation between the proportion of Immigrants from Nigeria and percentage of population with at least 4th grade education in the United States with a correlation coefficient (R) of 0.424 and weighted average of 97.0%, a difference of 1.1%.
4th Grade Correlation Summary
| Measurement | White/Caucasian | Immigrants from Nigeria |
| Minimum | 93.2% | 92.9% |
| Maximum | 99.2% | 100.0% |
| Range | 6.0% | 7.1% |
| Mean | 97.1% | 97.3% |
| Median | 97.3% | 97.2% |
| Interquartile 25% (IQ1) | 96.0% | 96.4% |
| Interquartile 75% (IQ3) | 98.6% | 99.3% |
| Interquartile Range (IQR) | 2.6% | 2.9% |
| Standard Deviation (Sample) | 1.5% | 2.0% |
| Standard Deviation (Population) | 1.5% | 2.0% |
Similar Demographics by 4th Grade
Demographics Similar to Whites/Caucasians by 4th Grade
In terms of 4th grade, the demographic groups most similar to Whites/Caucasians are Slavic (98.1%, a difference of 0.0%), Maltese (98.1%, a difference of 0.0%), Greek (98.1%, a difference of 0.0%), Austrian (98.1%, a difference of 0.0%), and Immigrants from Scotland (98.1%, a difference of 0.010%).
| Demographics | Rating | Rank | 4th Grade |
| Estonians | 99.8 /100 | #48 | Exceptional 98.1% |
| Bulgarians | 99.8 /100 | #49 | Exceptional 98.1% |
| Immigrants | Scotland | 99.8 /100 | #50 | Exceptional 98.1% |
| Celtics | 99.8 /100 | #51 | Exceptional 98.1% |
| Australians | 99.8 /100 | #52 | Exceptional 98.1% |
| Slavs | 99.8 /100 | #53 | Exceptional 98.1% |
| Maltese | 99.8 /100 | #54 | Exceptional 98.1% |
| Whites/Caucasians | 99.8 /100 | #55 | Exceptional 98.1% |
| Greeks | 99.8 /100 | #56 | Exceptional 98.1% |
| Austrians | 99.8 /100 | #57 | Exceptional 98.1% |
| Creek | 99.8 /100 | #58 | Exceptional 98.1% |
| Americans | 99.8 /100 | #59 | Exceptional 98.1% |
| Immigrants | Canada | 99.7 /100 | #60 | Exceptional 98.1% |
| Immigrants | North America | 99.7 /100 | #61 | Exceptional 98.1% |
| Serbians | 99.7 /100 | #62 | Exceptional 98.1% |
Demographics Similar to Immigrants from Nigeria by 4th Grade
In terms of 4th grade, the demographic groups most similar to Immigrants from Nigeria are Immigrants from China (97.0%, a difference of 0.0%), Taiwanese (97.0%, a difference of 0.010%), Armenian (97.0%, a difference of 0.010%), Ghanaian (97.0%, a difference of 0.010%), and Immigrants from Jamaica (97.0%, a difference of 0.020%).
| Demographics | Rating | Rank | 4th Grade |
| Immigrants | Sierra Leone | 0.4 /100 | #260 | Tragic 97.0% |
| Immigrants | South America | 0.4 /100 | #261 | Tragic 97.0% |
| West Indians | 0.4 /100 | #262 | Tragic 97.0% |
| Immigrants | Jamaica | 0.3 /100 | #263 | Tragic 97.0% |
| Taiwanese | 0.3 /100 | #264 | Tragic 97.0% |
| Armenians | 0.3 /100 | #265 | Tragic 97.0% |
| Immigrants | China | 0.3 /100 | #266 | Tragic 97.0% |
| Immigrants | Nigeria | 0.3 /100 | #267 | Tragic 97.0% |
| Ghanaians | 0.2 /100 | #268 | Tragic 97.0% |
| Immigrants | Uzbekistan | 0.2 /100 | #269 | Tragic 96.9% |
| Cubans | 0.2 /100 | #270 | Tragic 96.9% |
| Immigrants | Peru | 0.1 /100 | #271 | Tragic 96.9% |
| Fijians | 0.1 /100 | #272 | Tragic 96.9% |
| Immigrants | Cameroon | 0.1 /100 | #273 | Tragic 96.9% |
| Trinidadians and Tobagonians | 0.1 /100 | #274 | Tragic 96.9% |