White/Caucasian vs Immigrants from Bangladesh Unemployment Among Ages 25 to 29 years
COMPARE
White/Caucasian
Immigrants from Bangladesh
Unemployment Among Ages 25 to 29 years
Unemployment Among Ages 25 to 29 years Comparison
Whites/Caucasians
Immigrants from Bangladesh
6.9%
UNEMPLOYMENT AMONG AGES 25 TO 29 YEARS
10.6/ 100
METRIC RATING
219th/ 347
METRIC RANK
7.5%
UNEMPLOYMENT AMONG AGES 25 TO 29 YEARS
0.0/ 100
METRIC RATING
281st/ 347
METRIC RANK
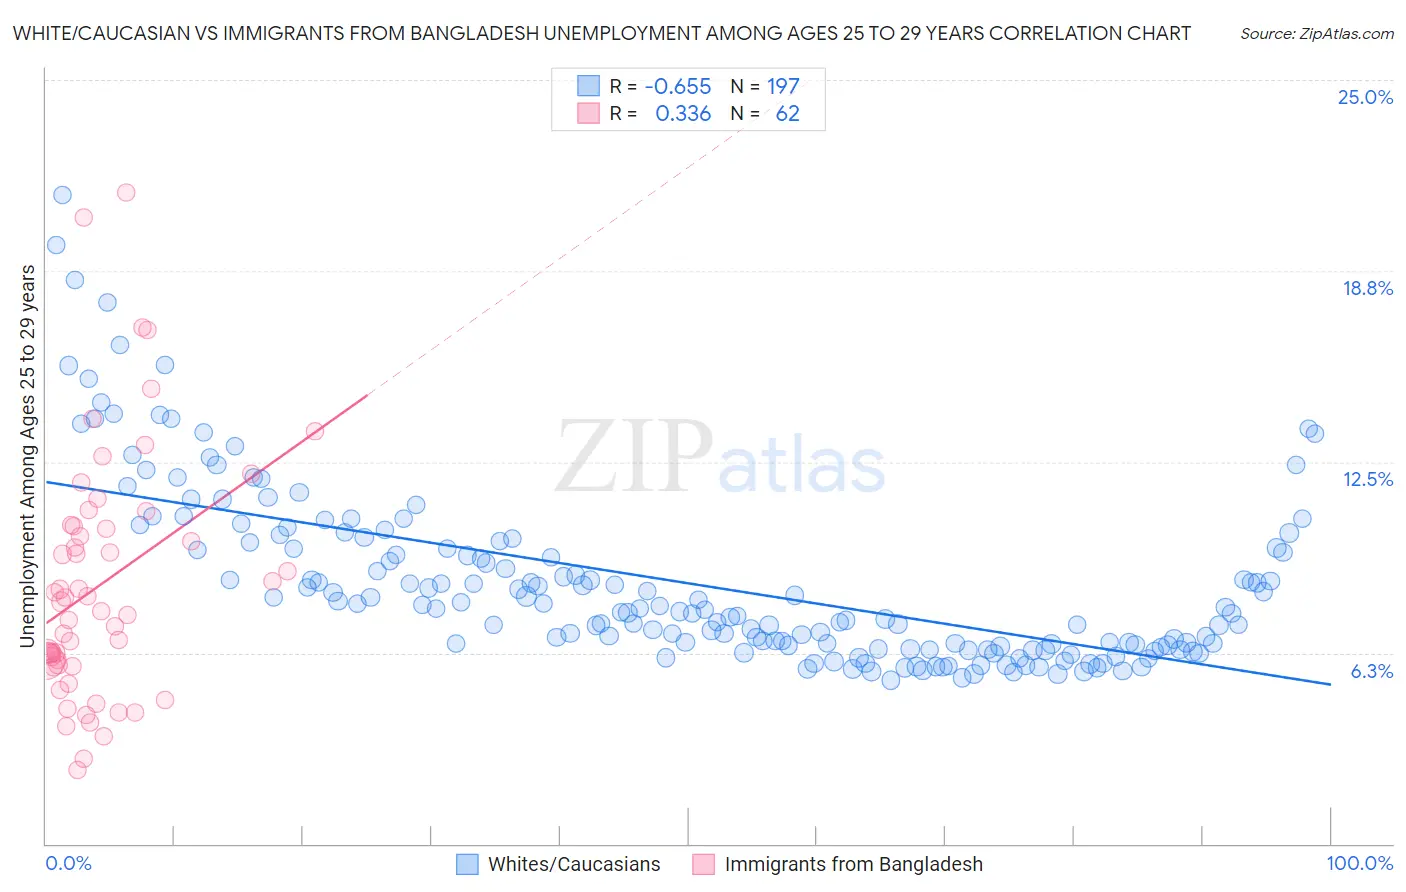
White/Caucasian vs Immigrants from Bangladesh Unemployment Among Ages 25 to 29 years Correlation Chart
The statistical analysis conducted on geographies consisting of 513,309,764 people shows a significant negative correlation between the proportion of Whites/Caucasians and unemployment rate among population between the ages 25 and 29 in the United States with a correlation coefficient (R) of -0.655 and weighted average of 6.9%. Similarly, the statistical analysis conducted on geographies consisting of 199,836,373 people shows a mild positive correlation between the proportion of Immigrants from Bangladesh and unemployment rate among population between the ages 25 and 29 in the United States with a correlation coefficient (R) of 0.336 and weighted average of 7.5%, a difference of 9.9%.
Unemployment Among Ages 25 to 29 years Correlation Summary
| Measurement | White/Caucasian | Immigrants from Bangladesh |
| Minimum | 5.3% | 2.4% |
| Maximum | 21.2% | 21.3% |
| Range | 15.9% | 18.9% |
| Mean | 8.5% | 8.5% |
| Median | 7.7% | 7.8% |
| Interquartile 25% (IQ1) | 6.5% | 5.8% |
| Interquartile 75% (IQ3) | 9.8% | 10.4% |
| Interquartile Range (IQR) | 3.3% | 4.6% |
| Standard Deviation (Sample) | 2.9% | 4.0% |
| Standard Deviation (Population) | 2.9% | 4.0% |
Similar Demographics by Unemployment Among Ages 25 to 29 years
Demographics Similar to Whites/Caucasians by Unemployment Among Ages 25 to 29 years
In terms of unemployment among ages 25 to 29 years, the demographic groups most similar to Whites/Caucasians are French (6.9%, a difference of 0.010%), Israeli (6.9%, a difference of 0.13%), Immigrants from Austria (6.8%, a difference of 0.26%), Ute (6.8%, a difference of 0.40%), and Slovak (6.8%, a difference of 0.51%).
| Demographics | Rating | Rank | Unemployment Among Ages 25 to 29 years |
| Immigrants | Cabo Verde | 16.2 /100 | #212 | Poor 6.8% |
| Immigrants | Syria | 15.1 /100 | #213 | Poor 6.8% |
| Liberians | 14.7 /100 | #214 | Poor 6.8% |
| Spanish | 14.4 /100 | #215 | Poor 6.8% |
| Slovaks | 14.3 /100 | #216 | Poor 6.8% |
| Ute | 13.4 /100 | #217 | Poor 6.8% |
| Immigrants | Austria | 12.3 /100 | #218 | Poor 6.8% |
| Whites/Caucasians | 10.6 /100 | #219 | Poor 6.9% |
| French | 10.5 /100 | #220 | Poor 6.9% |
| Israelis | 9.8 /100 | #221 | Tragic 6.9% |
| Spaniards | 7.7 /100 | #222 | Tragic 6.9% |
| Celtics | 7.6 /100 | #223 | Tragic 6.9% |
| Immigrants | Immigrants | 6.2 /100 | #224 | Tragic 6.9% |
| Japanese | 5.4 /100 | #225 | Tragic 6.9% |
| Immigrants | Liberia | 4.8 /100 | #226 | Tragic 7.0% |
Demographics Similar to Immigrants from Bangladesh by Unemployment Among Ages 25 to 29 years
In terms of unemployment among ages 25 to 29 years, the demographic groups most similar to Immigrants from Bangladesh are Immigrants from Caribbean (7.5%, a difference of 0.090%), Immigrants from Senegal (7.6%, a difference of 0.17%), Nepalese (7.5%, a difference of 0.23%), Creek (7.6%, a difference of 0.34%), and Cherokee (7.6%, a difference of 0.35%).
| Demographics | Rating | Rank | Unemployment Among Ages 25 to 29 years |
| Immigrants | Central America | 0.0 /100 | #274 | Tragic 7.5% |
| Immigrants | Ghana | 0.0 /100 | #275 | Tragic 7.5% |
| French American Indians | 0.0 /100 | #276 | Tragic 7.5% |
| Iroquois | 0.0 /100 | #277 | Tragic 7.5% |
| Mexicans | 0.0 /100 | #278 | Tragic 7.5% |
| Nepalese | 0.0 /100 | #279 | Tragic 7.5% |
| Immigrants | Caribbean | 0.0 /100 | #280 | Tragic 7.5% |
| Immigrants | Bangladesh | 0.0 /100 | #281 | Tragic 7.5% |
| Immigrants | Senegal | 0.0 /100 | #282 | Tragic 7.6% |
| Creek | 0.0 /100 | #283 | Tragic 7.6% |
| Cherokee | 0.0 /100 | #284 | Tragic 7.6% |
| Senegalese | 0.0 /100 | #285 | Tragic 7.6% |
| Vietnamese | 0.0 /100 | #286 | Tragic 7.6% |
| Immigrants | Mexico | 0.0 /100 | #287 | Tragic 7.6% |
| Africans | 0.0 /100 | #288 | Tragic 7.6% |