Cambodian vs Immigrants from Bangladesh Divorced or Separated
COMPARE
Cambodian
Immigrants from Bangladesh
Divorced or Separated
Divorced or Separated Comparison
Cambodians
Immigrants from Bangladesh
11.1%
DIVORCED OR SEPARATED
100.0/ 100
METRIC RATING
35th/ 347
METRIC RANK
11.0%
DIVORCED OR SEPARATED
100.0/ 100
METRIC RATING
27th/ 347
METRIC RANK
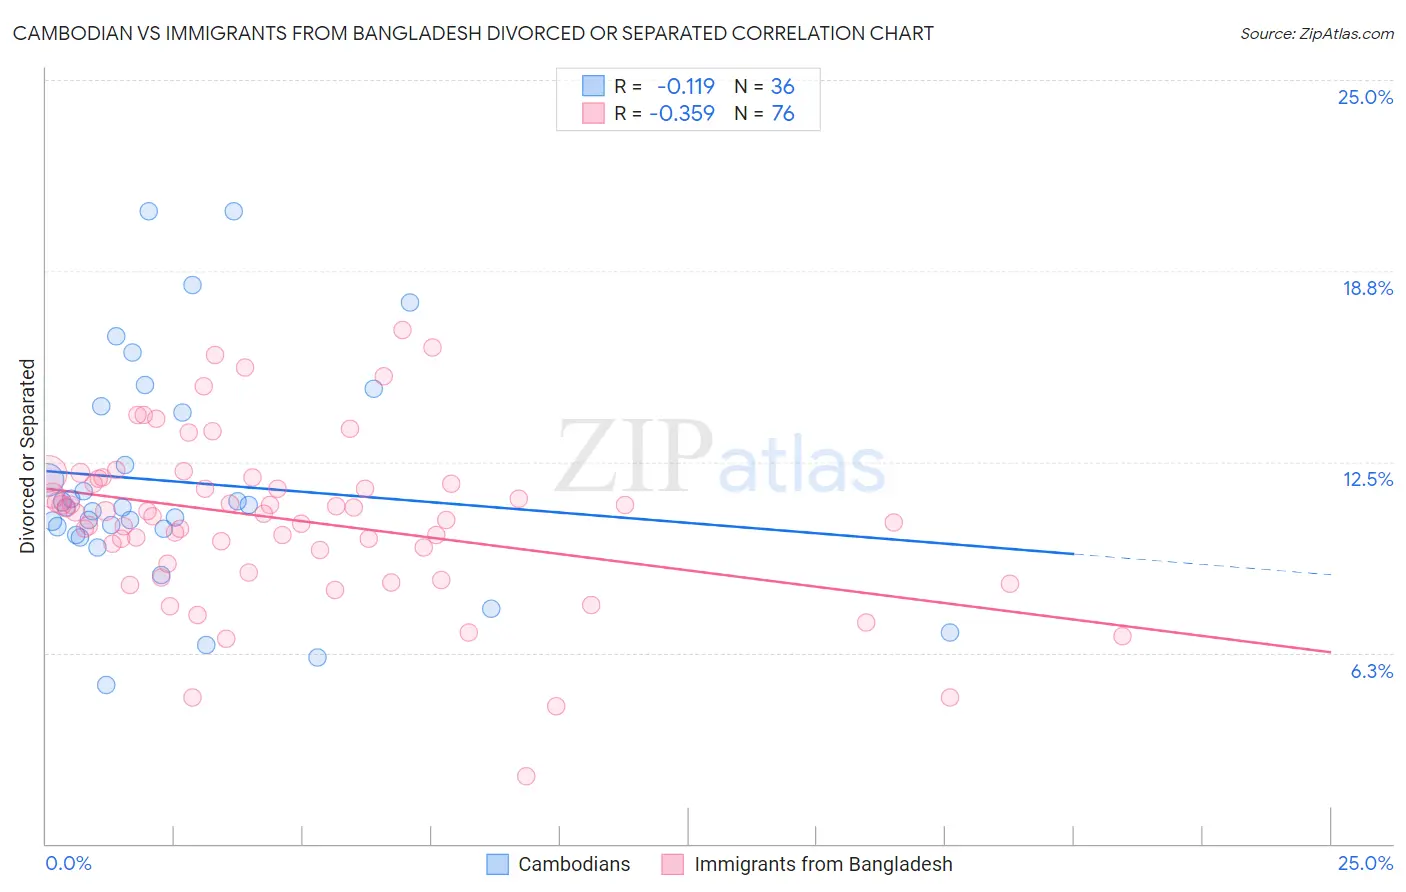
Cambodian vs Immigrants from Bangladesh Divorced or Separated Correlation Chart
The statistical analysis conducted on geographies consisting of 102,489,900 people shows a poor negative correlation between the proportion of Cambodians and percentage of population currently divorced or separated in the United States with a correlation coefficient (R) of -0.119 and weighted average of 11.1%. Similarly, the statistical analysis conducted on geographies consisting of 203,592,218 people shows a mild negative correlation between the proportion of Immigrants from Bangladesh and percentage of population currently divorced or separated in the United States with a correlation coefficient (R) of -0.359 and weighted average of 11.0%, a difference of 1.2%.
Divorced or Separated Correlation Summary
| Measurement | Cambodian | Immigrants from Bangladesh |
| Minimum | 5.2% | 2.2% |
| Maximum | 20.7% | 16.8% |
| Range | 15.5% | 14.6% |
| Mean | 11.8% | 10.6% |
| Median | 11.0% | 10.8% |
| Interquartile 25% (IQ1) | 10.2% | 9.4% |
| Interquartile 75% (IQ3) | 14.2% | 11.9% |
| Interquartile Range (IQR) | 4.0% | 2.5% |
| Standard Deviation (Sample) | 3.7% | 2.7% |
| Standard Deviation (Population) | 3.7% | 2.7% |
Demographics Similar to Cambodians and Immigrants from Bangladesh by Divorced or Separated
In terms of divorced or separated, the demographic groups most similar to Cambodians are Immigrants from Japan (11.1%, a difference of 0.060%), Immigrants from Lebanon (11.1%, a difference of 0.070%), Immigrants from Uzbekistan (11.1%, a difference of 0.080%), Immigrants from Greece (11.1%, a difference of 0.13%), and Egyptian (11.1%, a difference of 0.15%). Similarly, the demographic groups most similar to Immigrants from Bangladesh are Immigrants from Malaysia (11.0%, a difference of 0.030%), Armenian (11.0%, a difference of 0.10%), Immigrants from Indonesia (10.9%, a difference of 0.44%), Immigrants from Ireland (11.0%, a difference of 0.62%), and Mongolian (11.1%, a difference of 0.92%).
| Demographics | Rating | Rank | Divorced or Separated |
| Immigrants | Asia | 100.0 /100 | #21 | Exceptional 10.7% |
| Vietnamese | 100.0 /100 | #22 | Exceptional 10.8% |
| Immigrants | Pakistan | 100.0 /100 | #23 | Exceptional 10.8% |
| Immigrants | Sri Lanka | 100.0 /100 | #24 | Exceptional 10.8% |
| Iranians | 100.0 /100 | #25 | Exceptional 10.8% |
| Immigrants | Indonesia | 100.0 /100 | #26 | Exceptional 10.9% |
| Immigrants | Bangladesh | 100.0 /100 | #27 | Exceptional 11.0% |
| Immigrants | Malaysia | 100.0 /100 | #28 | Exceptional 11.0% |
| Armenians | 100.0 /100 | #29 | Exceptional 11.0% |
| Immigrants | Ireland | 100.0 /100 | #30 | Exceptional 11.0% |
| Mongolians | 100.0 /100 | #31 | Exceptional 11.1% |
| Tongans | 100.0 /100 | #32 | Exceptional 11.1% |
| Egyptians | 100.0 /100 | #33 | Exceptional 11.1% |
| Immigrants | Uzbekistan | 100.0 /100 | #34 | Exceptional 11.1% |
| Cambodians | 100.0 /100 | #35 | Exceptional 11.1% |
| Immigrants | Japan | 100.0 /100 | #36 | Exceptional 11.1% |
| Immigrants | Lebanon | 100.0 /100 | #37 | Exceptional 11.1% |
| Immigrants | Greece | 100.0 /100 | #38 | Exceptional 11.1% |
| Immigrants | Egypt | 100.0 /100 | #39 | Exceptional 11.1% |
| Soviet Union | 100.0 /100 | #40 | Exceptional 11.1% |
| Bhutanese | 100.0 /100 | #41 | Exceptional 11.2% |