Costa Rican vs Bahamian Family Households
COMPARE
Costa Rican
Bahamian
Family Households
Family Households Comparison
Costa Ricans
Bahamians
65.9%
FAMILY HOUSEHOLDS
99.9/ 100
METRIC RATING
65th/ 347
METRIC RANK
63.3%
FAMILY HOUSEHOLDS
1.1/ 100
METRIC RATING
252nd/ 347
METRIC RANK
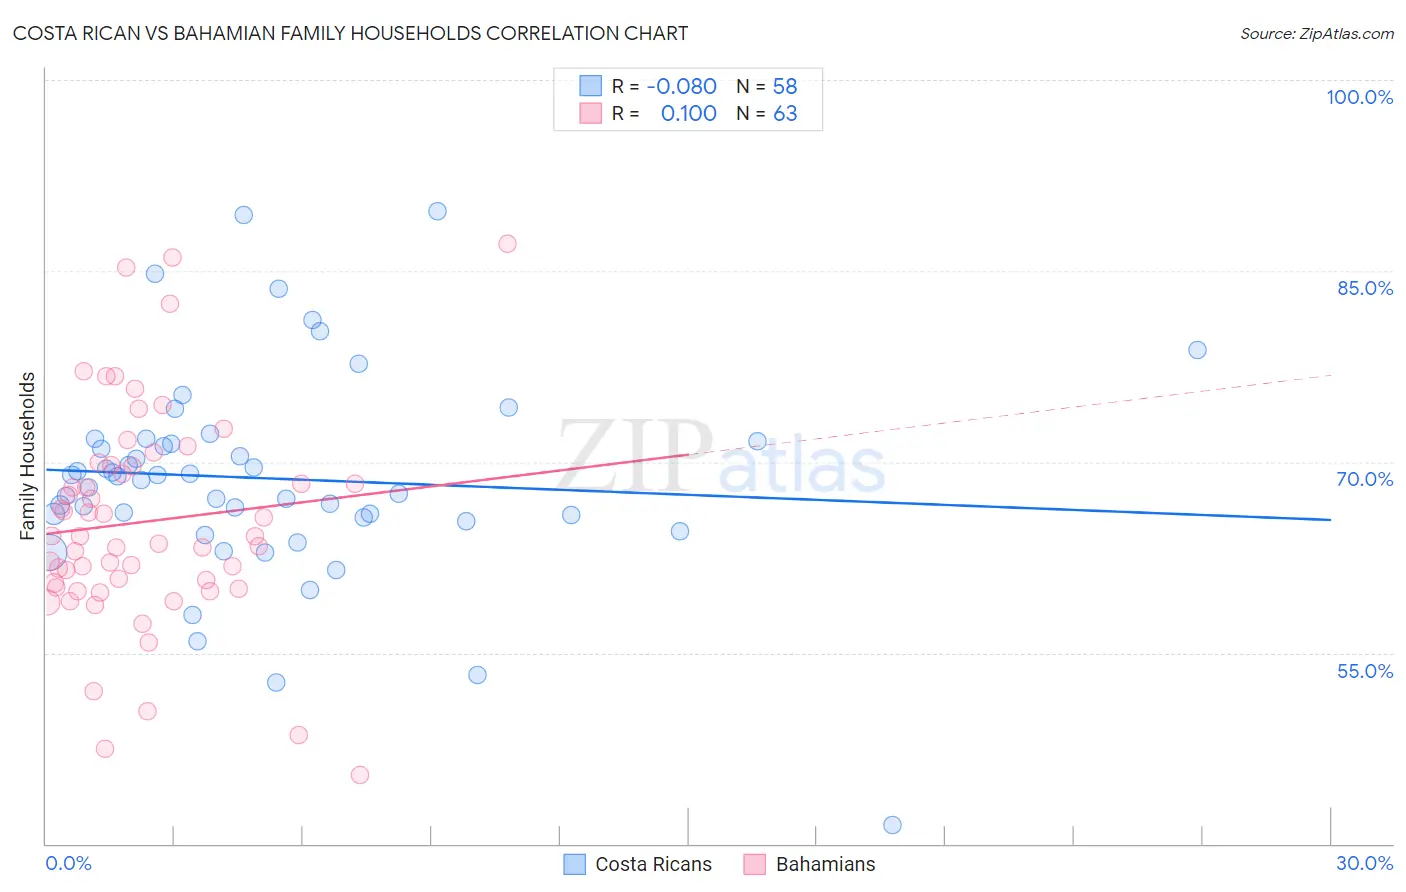
Costa Rican vs Bahamian Family Households Correlation Chart
The statistical analysis conducted on geographies consisting of 253,469,677 people shows a slight negative correlation between the proportion of Costa Ricans and percentage of family households in the United States with a correlation coefficient (R) of -0.080 and weighted average of 65.9%. Similarly, the statistical analysis conducted on geographies consisting of 112,635,727 people shows a slight positive correlation between the proportion of Bahamians and percentage of family households in the United States with a correlation coefficient (R) of 0.100 and weighted average of 63.3%, a difference of 4.1%.
Family Households Correlation Summary
| Measurement | Costa Rican | Bahamian |
| Minimum | 41.4% | 45.4% |
| Maximum | 89.7% | 87.2% |
| Range | 48.2% | 41.8% |
| Mean | 68.7% | 65.3% |
| Median | 68.7% | 64.1% |
| Interquartile 25% (IQ1) | 65.6% | 60.1% |
| Interquartile 75% (IQ3) | 71.6% | 69.7% |
| Interquartile Range (IQR) | 6.0% | 9.6% |
| Standard Deviation (Sample) | 8.2% | 8.6% |
| Standard Deviation (Population) | 8.2% | 8.5% |
Similar Demographics by Family Households
Demographics Similar to Costa Ricans by Family Households
In terms of family households, the demographic groups most similar to Costa Ricans are Pima (65.9%, a difference of 0.010%), Fijian (65.9%, a difference of 0.040%), Filipino (65.9%, a difference of 0.040%), Japanese (65.9%, a difference of 0.060%), and Immigrants from Indonesia (66.0%, a difference of 0.070%).
| Demographics | Rating | Rank | Family Households |
| Immigrants | Asia | 100.0 /100 | #58 | Exceptional 66.1% |
| Immigrants | Korea | 100.0 /100 | #59 | Exceptional 66.0% |
| South Americans | 100.0 /100 | #60 | Exceptional 66.0% |
| Danes | 100.0 /100 | #61 | Exceptional 66.0% |
| Central Americans | 100.0 /100 | #62 | Exceptional 66.0% |
| Immigrants | Indonesia | 100.0 /100 | #63 | Exceptional 66.0% |
| Pima | 99.9 /100 | #64 | Exceptional 65.9% |
| Costa Ricans | 99.9 /100 | #65 | Exceptional 65.9% |
| Fijians | 99.9 /100 | #66 | Exceptional 65.9% |
| Filipinos | 99.9 /100 | #67 | Exceptional 65.9% |
| Japanese | 99.9 /100 | #68 | Exceptional 65.9% |
| Malaysians | 99.9 /100 | #69 | Exceptional 65.9% |
| Immigrants | Afghanistan | 99.9 /100 | #70 | Exceptional 65.9% |
| Bhutanese | 99.9 /100 | #71 | Exceptional 65.9% |
| Portuguese | 99.9 /100 | #72 | Exceptional 65.8% |
Demographics Similar to Bahamians by Family Households
In terms of family households, the demographic groups most similar to Bahamians are Taiwanese (63.3%, a difference of 0.010%), Immigrants from Dominican Republic (63.3%, a difference of 0.020%), Slovak (63.3%, a difference of 0.030%), Potawatomi (63.3%, a difference of 0.050%), and Immigrants from Japan (63.4%, a difference of 0.070%).
| Demographics | Rating | Rank | Family Households |
| Immigrants | Dominica | 1.6 /100 | #245 | Tragic 63.4% |
| Immigrants | Ghana | 1.6 /100 | #246 | Tragic 63.4% |
| Immigrants | Uzbekistan | 1.5 /100 | #247 | Tragic 63.4% |
| Dominicans | 1.5 /100 | #248 | Tragic 63.4% |
| Russians | 1.4 /100 | #249 | Tragic 63.4% |
| Immigrants | Japan | 1.4 /100 | #250 | Tragic 63.4% |
| Taiwanese | 1.2 /100 | #251 | Tragic 63.3% |
| Bahamians | 1.1 /100 | #252 | Tragic 63.3% |
| Immigrants | Dominican Republic | 1.0 /100 | #253 | Tragic 63.3% |
| Slovaks | 1.0 /100 | #254 | Tragic 63.3% |
| Potawatomi | 1.0 /100 | #255 | Tragic 63.3% |
| Luxembourgers | 0.9 /100 | #256 | Tragic 63.3% |
| Icelanders | 0.8 /100 | #257 | Tragic 63.3% |
| Immigrants | Barbados | 0.7 /100 | #258 | Tragic 63.2% |
| Immigrants | Western Europe | 0.6 /100 | #259 | Tragic 63.2% |