Immigrants from Turkey vs Bahamian Family Households
COMPARE
Immigrants from Turkey
Bahamian
Family Households
Family Households Comparison
Immigrants from Turkey
Bahamians
63.1%
FAMILY HOUSEHOLDS
0.3/ 100
METRIC RATING
272nd/ 347
METRIC RANK
63.3%
FAMILY HOUSEHOLDS
1.1/ 100
METRIC RATING
252nd/ 347
METRIC RANK
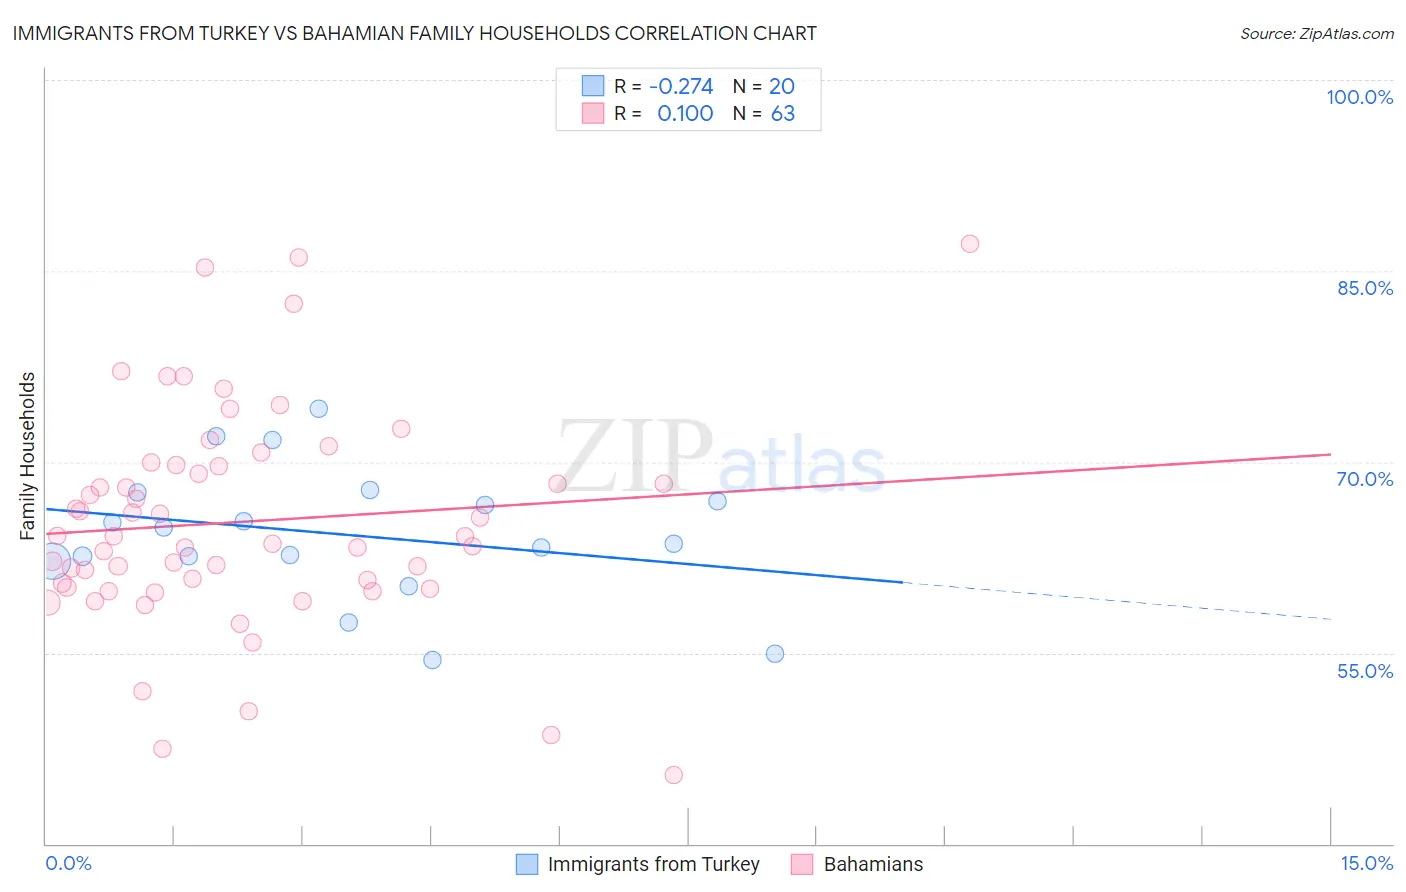
Immigrants from Turkey vs Bahamian Family Households Correlation Chart
The statistical analysis conducted on geographies consisting of 222,976,596 people shows a weak negative correlation between the proportion of Immigrants from Turkey and percentage of family households in the United States with a correlation coefficient (R) of -0.274 and weighted average of 63.1%. Similarly, the statistical analysis conducted on geographies consisting of 112,635,727 people shows a slight positive correlation between the proportion of Bahamians and percentage of family households in the United States with a correlation coefficient (R) of 0.100 and weighted average of 63.3%, a difference of 0.42%.
Family Households Correlation Summary
| Measurement | Immigrants from Turkey | Bahamian |
| Minimum | 54.4% | 45.4% |
| Maximum | 74.1% | 87.2% |
| Range | 19.7% | 41.8% |
| Mean | 64.3% | 65.3% |
| Median | 64.2% | 64.1% |
| Interquartile 25% (IQ1) | 62.4% | 60.1% |
| Interquartile 75% (IQ3) | 67.3% | 69.7% |
| Interquartile Range (IQR) | 4.9% | 9.6% |
| Standard Deviation (Sample) | 5.2% | 8.6% |
| Standard Deviation (Population) | 5.1% | 8.5% |
Demographics Similar to Immigrants from Turkey and Bahamians by Family Households
In terms of family households, the demographic groups most similar to Immigrants from Turkey are Immigrants from Croatia (63.1%, a difference of 0.0%), Immigrants from Austria (63.1%, a difference of 0.010%), Immigrants from Singapore (63.1%, a difference of 0.030%), Yugoslavian (63.1%, a difference of 0.030%), and Israeli (63.1%, a difference of 0.080%). Similarly, the demographic groups most similar to Bahamians are Immigrants from Dominican Republic (63.3%, a difference of 0.020%), Slovak (63.3%, a difference of 0.030%), Potawatomi (63.3%, a difference of 0.050%), Luxembourger (63.3%, a difference of 0.080%), and Icelander (63.3%, a difference of 0.12%).
| Demographics | Rating | Rank | Family Households |
| Bahamians | 1.1 /100 | #252 | Tragic 63.3% |
| Immigrants | Dominican Republic | 1.0 /100 | #253 | Tragic 63.3% |
| Slovaks | 1.0 /100 | #254 | Tragic 63.3% |
| Potawatomi | 1.0 /100 | #255 | Tragic 63.3% |
| Luxembourgers | 0.9 /100 | #256 | Tragic 63.3% |
| Icelanders | 0.8 /100 | #257 | Tragic 63.3% |
| Immigrants | Barbados | 0.7 /100 | #258 | Tragic 63.2% |
| Immigrants | Western Europe | 0.6 /100 | #259 | Tragic 63.2% |
| Cypriots | 0.6 /100 | #260 | Tragic 63.2% |
| Immigrants | Russia | 0.6 /100 | #261 | Tragic 63.2% |
| Immigrants | Ireland | 0.6 /100 | #262 | Tragic 63.2% |
| Cheyenne | 0.5 /100 | #263 | Tragic 63.2% |
| Kenyans | 0.5 /100 | #264 | Tragic 63.2% |
| Colville | 0.5 /100 | #265 | Tragic 63.2% |
| Immigrants | Western Africa | 0.5 /100 | #266 | Tragic 63.1% |
| Israelis | 0.4 /100 | #267 | Tragic 63.1% |
| Immigrants | Singapore | 0.4 /100 | #268 | Tragic 63.1% |
| Yugoslavians | 0.4 /100 | #269 | Tragic 63.1% |
| Immigrants | Austria | 0.3 /100 | #270 | Tragic 63.1% |
| Immigrants | Croatia | 0.3 /100 | #271 | Tragic 63.1% |
| Immigrants | Turkey | 0.3 /100 | #272 | Tragic 63.1% |