Immigrants from Malaysia vs Bahamian Family Households
COMPARE
Immigrants from Malaysia
Bahamian
Family Households
Family Households Comparison
Immigrants from Malaysia
Bahamians
64.0%
FAMILY HOUSEHOLDS
17.9/ 100
METRIC RATING
200th/ 347
METRIC RANK
63.3%
FAMILY HOUSEHOLDS
1.1/ 100
METRIC RATING
252nd/ 347
METRIC RANK
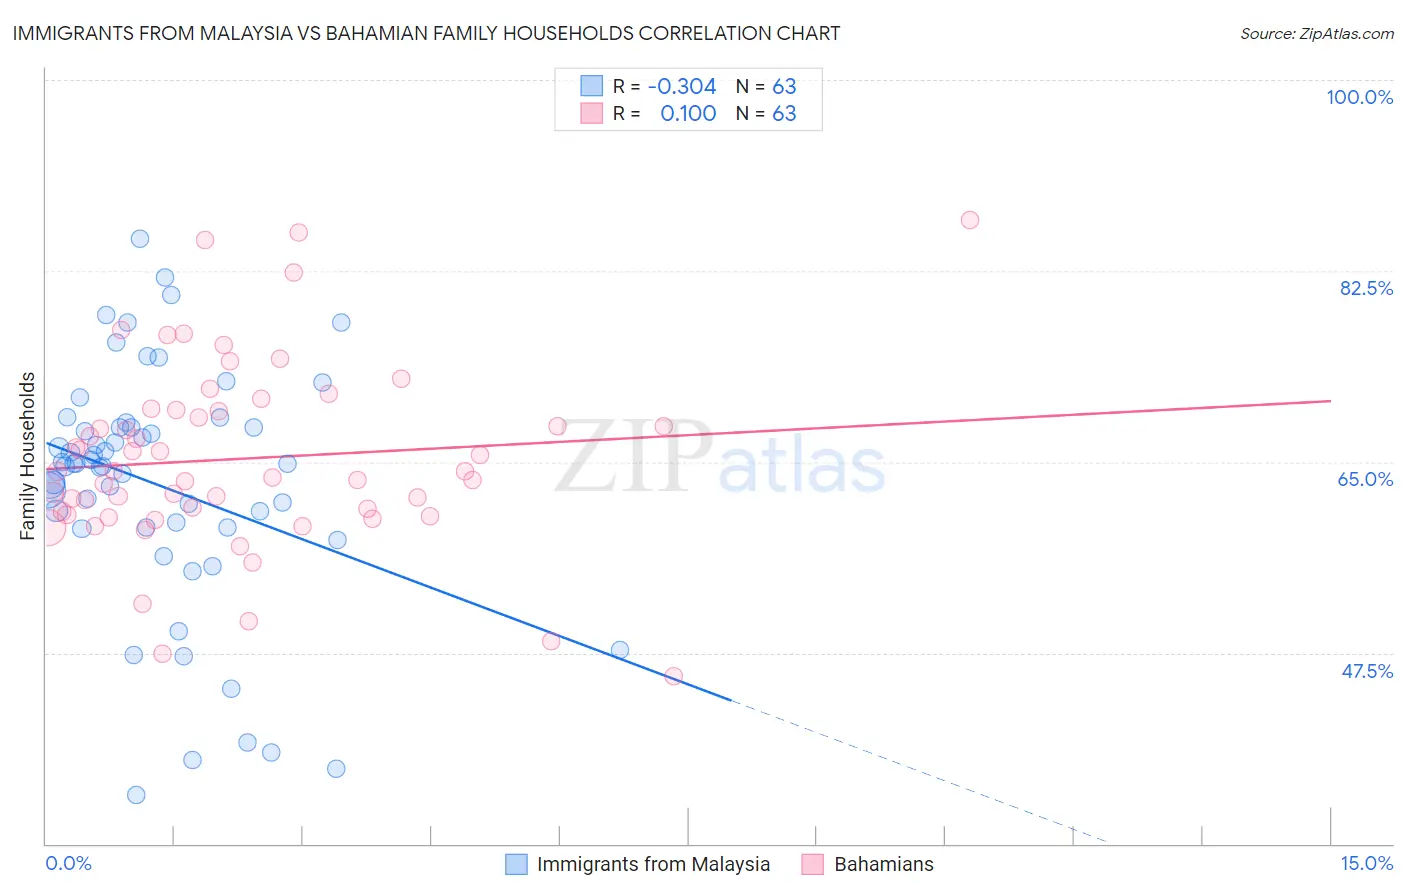
Immigrants from Malaysia vs Bahamian Family Households Correlation Chart
The statistical analysis conducted on geographies consisting of 197,925,894 people shows a mild negative correlation between the proportion of Immigrants from Malaysia and percentage of family households in the United States with a correlation coefficient (R) of -0.304 and weighted average of 64.0%. Similarly, the statistical analysis conducted on geographies consisting of 112,635,727 people shows a slight positive correlation between the proportion of Bahamians and percentage of family households in the United States with a correlation coefficient (R) of 0.100 and weighted average of 63.3%, a difference of 1.0%.
Family Households Correlation Summary
| Measurement | Immigrants from Malaysia | Bahamian |
| Minimum | 34.5% | 45.4% |
| Maximum | 85.4% | 87.2% |
| Range | 50.9% | 41.8% |
| Mean | 62.8% | 65.3% |
| Median | 64.8% | 64.1% |
| Interquartile 25% (IQ1) | 59.0% | 60.1% |
| Interquartile 75% (IQ3) | 68.2% | 69.7% |
| Interquartile Range (IQR) | 9.2% | 9.6% |
| Standard Deviation (Sample) | 11.1% | 8.6% |
| Standard Deviation (Population) | 11.0% | 8.5% |
Similar Demographics by Family Households
Demographics Similar to Immigrants from Malaysia by Family Households
In terms of family households, the demographic groups most similar to Immigrants from Malaysia are Seminole (64.0%, a difference of 0.020%), Polish (64.0%, a difference of 0.020%), Slavic (64.0%, a difference of 0.020%), Immigrants from Eastern Europe (64.0%, a difference of 0.020%), and Immigrants from Canada (64.0%, a difference of 0.030%).
| Demographics | Rating | Rank | Family Households |
| French | 23.7 /100 | #193 | Fair 64.0% |
| Paiute | 22.2 /100 | #194 | Fair 64.0% |
| Immigrants | North America | 20.0 /100 | #195 | Poor 64.0% |
| Immigrants | Canada | 19.2 /100 | #196 | Poor 64.0% |
| Seminole | 18.9 /100 | #197 | Poor 64.0% |
| Poles | 18.9 /100 | #198 | Poor 64.0% |
| Slavs | 18.6 /100 | #199 | Poor 64.0% |
| Immigrants | Malaysia | 17.9 /100 | #200 | Poor 64.0% |
| Immigrants | Eastern Europe | 17.2 /100 | #201 | Poor 64.0% |
| Iranians | 13.5 /100 | #202 | Poor 63.9% |
| Norwegians | 13.2 /100 | #203 | Poor 63.9% |
| Immigrants | Uruguay | 12.8 /100 | #204 | Poor 63.9% |
| Brazilians | 12.4 /100 | #205 | Poor 63.9% |
| Immigrants | Lithuania | 12.1 /100 | #206 | Poor 63.9% |
| Nigerians | 11.5 /100 | #207 | Poor 63.9% |
Demographics Similar to Bahamians by Family Households
In terms of family households, the demographic groups most similar to Bahamians are Taiwanese (63.3%, a difference of 0.010%), Immigrants from Dominican Republic (63.3%, a difference of 0.020%), Slovak (63.3%, a difference of 0.030%), Potawatomi (63.3%, a difference of 0.050%), and Immigrants from Japan (63.4%, a difference of 0.070%).
| Demographics | Rating | Rank | Family Households |
| Immigrants | Dominica | 1.6 /100 | #245 | Tragic 63.4% |
| Immigrants | Ghana | 1.6 /100 | #246 | Tragic 63.4% |
| Immigrants | Uzbekistan | 1.5 /100 | #247 | Tragic 63.4% |
| Dominicans | 1.5 /100 | #248 | Tragic 63.4% |
| Russians | 1.4 /100 | #249 | Tragic 63.4% |
| Immigrants | Japan | 1.4 /100 | #250 | Tragic 63.4% |
| Taiwanese | 1.2 /100 | #251 | Tragic 63.3% |
| Bahamians | 1.1 /100 | #252 | Tragic 63.3% |
| Immigrants | Dominican Republic | 1.0 /100 | #253 | Tragic 63.3% |
| Slovaks | 1.0 /100 | #254 | Tragic 63.3% |
| Potawatomi | 1.0 /100 | #255 | Tragic 63.3% |
| Luxembourgers | 0.9 /100 | #256 | Tragic 63.3% |
| Icelanders | 0.8 /100 | #257 | Tragic 63.3% |
| Immigrants | Barbados | 0.7 /100 | #258 | Tragic 63.2% |
| Immigrants | Western Europe | 0.6 /100 | #259 | Tragic 63.2% |