Welsh vs Slovak Single Father Households
COMPARE
Welsh
Slovak
Single Father Households
Single Father Households Comparison
Welsh
Slovaks
2.3%
SINGLE FATHER HOUSEHOLDS
44.0/ 100
METRIC RATING
179th/ 347
METRIC RANK
2.2%
SINGLE FATHER HOUSEHOLDS
90.7/ 100
METRIC RATING
144th/ 347
METRIC RANK
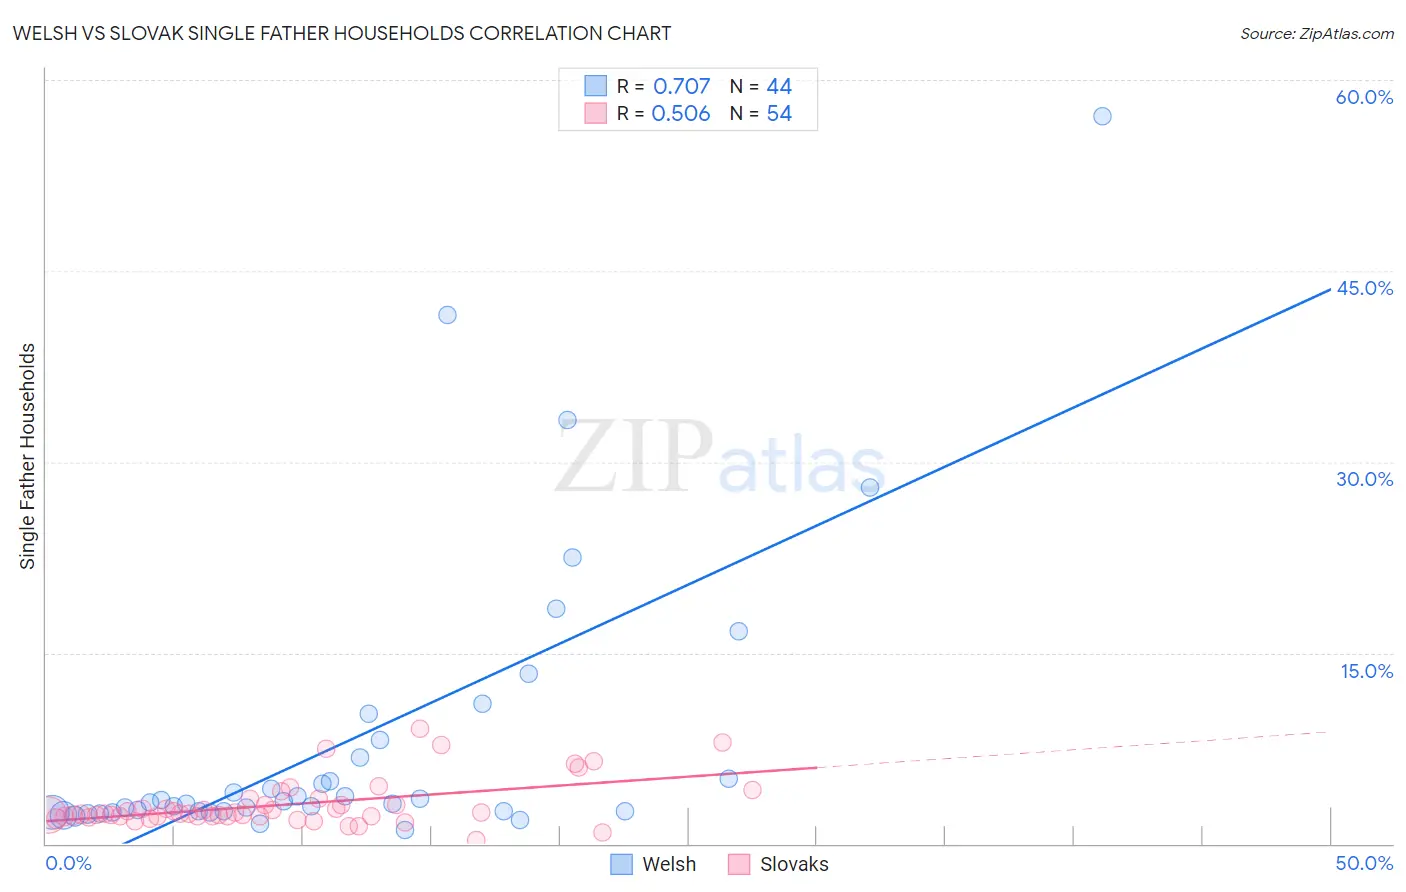
Welsh vs Slovak Single Father Households Correlation Chart
The statistical analysis conducted on geographies consisting of 518,370,143 people shows a strong positive correlation between the proportion of Welsh and percentage of single father households in the United States with a correlation coefficient (R) of 0.707 and weighted average of 2.3%. Similarly, the statistical analysis conducted on geographies consisting of 393,166,504 people shows a substantial positive correlation between the proportion of Slovaks and percentage of single father households in the United States with a correlation coefficient (R) of 0.506 and weighted average of 2.2%, a difference of 4.8%.
Single Father Households Correlation Summary
| Measurement | Welsh | Slovak |
| Minimum | 1.1% | 0.26% |
| Maximum | 57.1% | 9.0% |
| Range | 56.0% | 8.8% |
| Mean | 8.3% | 3.1% |
| Median | 3.3% | 2.3% |
| Interquartile 25% (IQ1) | 2.6% | 2.1% |
| Interquartile 75% (IQ3) | 7.5% | 3.0% |
| Interquartile Range (IQR) | 4.9% | 0.91% |
| Standard Deviation (Sample) | 11.7% | 1.8% |
| Standard Deviation (Population) | 11.5% | 1.8% |
Similar Demographics by Single Father Households
Demographics Similar to Welsh by Single Father Households
In terms of single father households, the demographic groups most similar to Welsh are Costa Rican (2.3%, a difference of 0.0%), Yugoslavian (2.3%, a difference of 0.010%), Jamaican (2.3%, a difference of 0.040%), Belgian (2.3%, a difference of 0.060%), and Immigrants from Panama (2.4%, a difference of 0.16%).
| Demographics | Rating | Rank | Single Father Households |
| Czechoslovakians | 58.9 /100 | #172 | Average 2.3% |
| Celtics | 55.4 /100 | #173 | Average 2.3% |
| Afghans | 50.0 /100 | #174 | Average 2.3% |
| Immigrants | Jamaica | 49.1 /100 | #175 | Average 2.3% |
| Danes | 48.2 /100 | #176 | Average 2.3% |
| Colombians | 48.0 /100 | #177 | Average 2.3% |
| Costa Ricans | 44.1 /100 | #178 | Average 2.3% |
| Welsh | 44.0 /100 | #179 | Average 2.3% |
| Yugoslavians | 43.9 /100 | #180 | Average 2.3% |
| Jamaicans | 43.5 /100 | #181 | Average 2.3% |
| Belgians | 43.3 /100 | #182 | Average 2.3% |
| Immigrants | Panama | 41.8 /100 | #183 | Average 2.4% |
| Sri Lankans | 41.8 /100 | #184 | Average 2.4% |
| Nigerians | 41.0 /100 | #185 | Average 2.4% |
| Immigrants | Bosnia and Herzegovina | 40.4 /100 | #186 | Average 2.4% |
Demographics Similar to Slovaks by Single Father Households
In terms of single father households, the demographic groups most similar to Slovaks are Immigrants from Zimbabwe (2.2%, a difference of 0.11%), Northern European (2.2%, a difference of 0.19%), Immigrants from Nepal (2.2%, a difference of 0.34%), Slavic (2.2%, a difference of 0.37%), and Luxembourger (2.2%, a difference of 0.40%).
| Demographics | Rating | Rank | Single Father Households |
| Austrians | 94.2 /100 | #137 | Exceptional 2.2% |
| West Indians | 94.1 /100 | #138 | Exceptional 2.2% |
| Brazilians | 92.8 /100 | #139 | Exceptional 2.2% |
| British | 92.8 /100 | #140 | Exceptional 2.2% |
| Laotians | 92.5 /100 | #141 | Exceptional 2.2% |
| Luxembourgers | 92.3 /100 | #142 | Exceptional 2.2% |
| Immigrants | Nepal | 92.1 /100 | #143 | Exceptional 2.2% |
| Slovaks | 90.7 /100 | #144 | Exceptional 2.2% |
| Immigrants | Zimbabwe | 90.2 /100 | #145 | Exceptional 2.2% |
| Northern Europeans | 89.8 /100 | #146 | Excellent 2.2% |
| Slavs | 88.9 /100 | #147 | Excellent 2.2% |
| South American Indians | 88.5 /100 | #148 | Excellent 2.3% |
| Senegalese | 88.4 /100 | #149 | Excellent 2.3% |
| Venezuelans | 86.2 /100 | #150 | Excellent 2.3% |
| Immigrants | Syria | 84.8 /100 | #151 | Excellent 2.3% |