Welsh vs Immigrants from West Indies Single Father Households
COMPARE
Welsh
Immigrants from West Indies
Single Father Households
Single Father Households Comparison
Welsh
Immigrants from West Indies
2.3%
SINGLE FATHER HOUSEHOLDS
44.0/ 100
METRIC RATING
179th/ 347
METRIC RANK
2.3%
SINGLE FATHER HOUSEHOLDS
77.9/ 100
METRIC RATING
159th/ 347
METRIC RANK
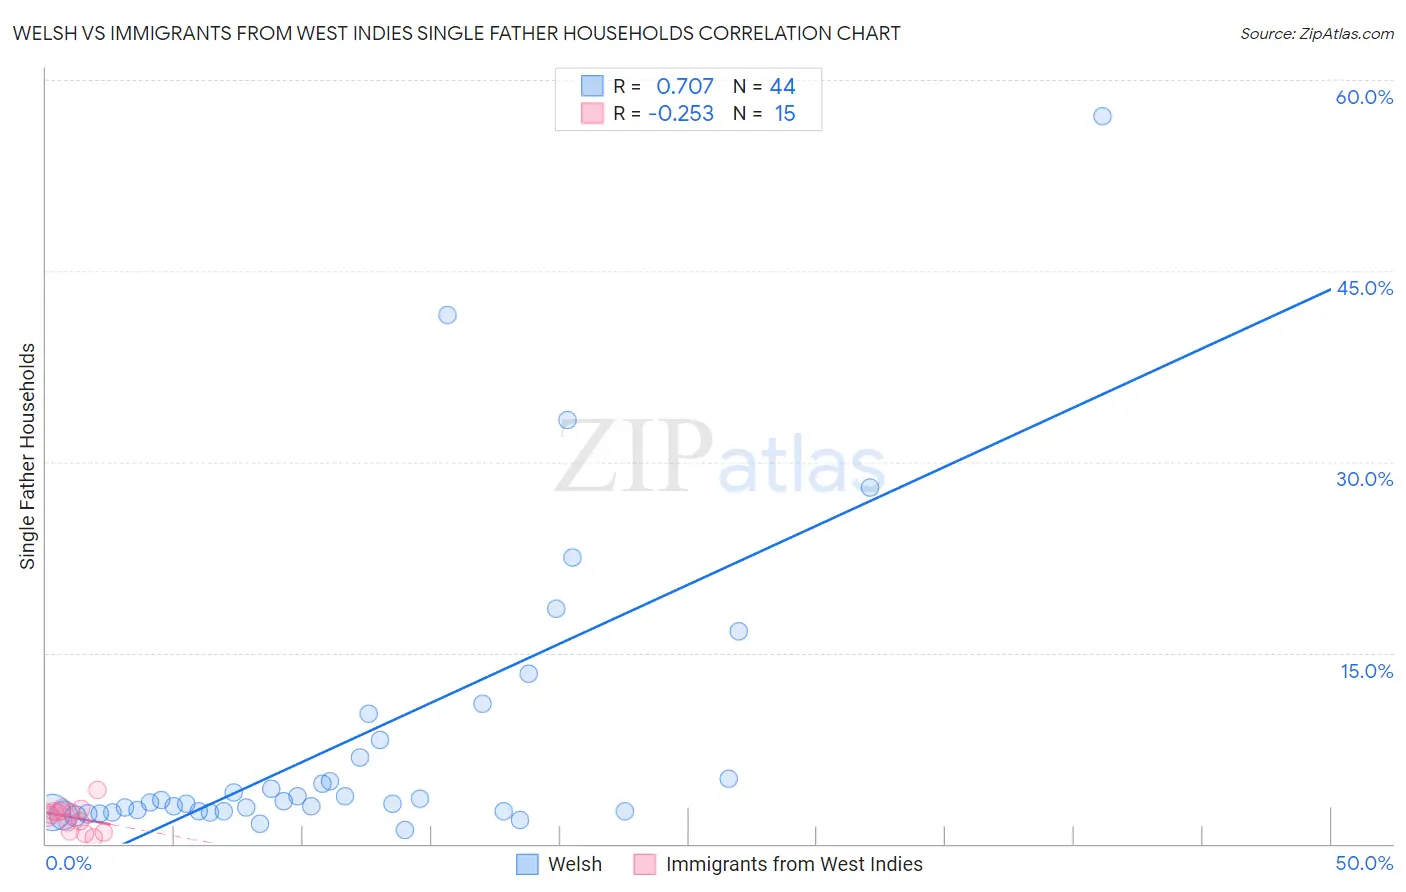
Welsh vs Immigrants from West Indies Single Father Households Correlation Chart
The statistical analysis conducted on geographies consisting of 518,370,143 people shows a strong positive correlation between the proportion of Welsh and percentage of single father households in the United States with a correlation coefficient (R) of 0.707 and weighted average of 2.3%. Similarly, the statistical analysis conducted on geographies consisting of 72,343,570 people shows a weak negative correlation between the proportion of Immigrants from West Indies and percentage of single father households in the United States with a correlation coefficient (R) of -0.253 and weighted average of 2.3%, a difference of 2.8%.
Single Father Households Correlation Summary
| Measurement | Welsh | Immigrants from West Indies |
| Minimum | 1.1% | 0.47% |
| Maximum | 57.1% | 4.3% |
| Range | 56.0% | 3.8% |
| Mean | 8.3% | 2.1% |
| Median | 3.3% | 2.3% |
| Interquartile 25% (IQ1) | 2.6% | 0.99% |
| Interquartile 75% (IQ3) | 7.5% | 2.6% |
| Interquartile Range (IQR) | 4.9% | 1.6% |
| Standard Deviation (Sample) | 11.7% | 0.99% |
| Standard Deviation (Population) | 11.5% | 0.95% |
Demographics Similar to Welsh and Immigrants from West Indies by Single Father Households
In terms of single father households, the demographic groups most similar to Welsh are Costa Rican (2.3%, a difference of 0.0%), Colombian (2.3%, a difference of 0.30%), Danish (2.3%, a difference of 0.31%), Immigrants from Jamaica (2.3%, a difference of 0.37%), and Afghan (2.3%, a difference of 0.44%). Similarly, the demographic groups most similar to Immigrants from West Indies are Immigrants from Bolivia (2.3%, a difference of 0.18%), Swiss (2.3%, a difference of 0.48%), Scottish (2.3%, a difference of 0.51%), Irish (2.3%, a difference of 0.59%), and Pakistani (2.3%, a difference of 0.73%).
| Demographics | Rating | Rank | Single Father Households |
| Immigrants | West Indies | 77.9 /100 | #159 | Good 2.3% |
| Immigrants | Bolivia | 76.3 /100 | #160 | Good 2.3% |
| Swiss | 73.2 /100 | #161 | Good 2.3% |
| Scottish | 72.8 /100 | #162 | Good 2.3% |
| Irish | 72.1 /100 | #163 | Good 2.3% |
| Pakistanis | 70.6 /100 | #164 | Good 2.3% |
| Scotch-Irish | 69.4 /100 | #165 | Good 2.3% |
| English | 68.6 /100 | #166 | Good 2.3% |
| South Americans | 64.3 /100 | #167 | Good 2.3% |
| Icelanders | 63.1 /100 | #168 | Good 2.3% |
| Czechs | 62.5 /100 | #169 | Good 2.3% |
| Ugandans | 62.2 /100 | #170 | Good 2.3% |
| Swedes | 61.6 /100 | #171 | Good 2.3% |
| Czechoslovakians | 58.9 /100 | #172 | Average 2.3% |
| Celtics | 55.4 /100 | #173 | Average 2.3% |
| Afghans | 50.0 /100 | #174 | Average 2.3% |
| Immigrants | Jamaica | 49.1 /100 | #175 | Average 2.3% |
| Danes | 48.2 /100 | #176 | Average 2.3% |
| Colombians | 48.0 /100 | #177 | Average 2.3% |
| Costa Ricans | 44.1 /100 | #178 | Average 2.3% |
| Welsh | 44.0 /100 | #179 | Average 2.3% |