Welsh vs Immigrants from Vietnam Single Father Households
COMPARE
Welsh
Immigrants from Vietnam
Single Father Households
Single Father Households Comparison
Welsh
Immigrants from Vietnam
2.3%
SINGLE FATHER HOUSEHOLDS
44.0/ 100
METRIC RATING
179th/ 347
METRIC RANK
2.4%
SINGLE FATHER HOUSEHOLDS
27.1/ 100
METRIC RATING
199th/ 347
METRIC RANK
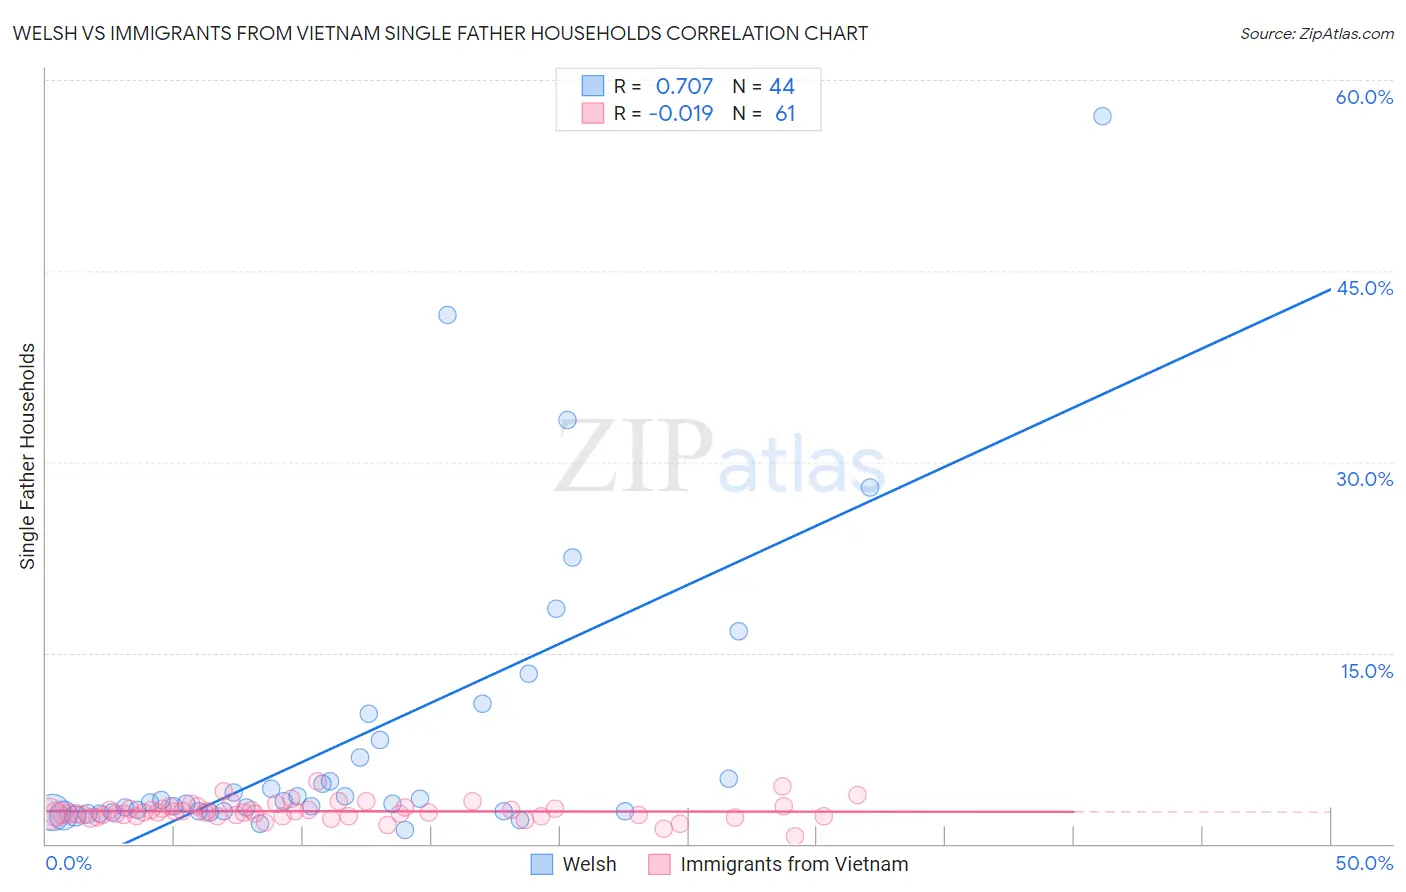
Welsh vs Immigrants from Vietnam Single Father Households Correlation Chart
The statistical analysis conducted on geographies consisting of 518,370,143 people shows a strong positive correlation between the proportion of Welsh and percentage of single father households in the United States with a correlation coefficient (R) of 0.707 and weighted average of 2.3%. Similarly, the statistical analysis conducted on geographies consisting of 401,755,034 people shows no correlation between the proportion of Immigrants from Vietnam and percentage of single father households in the United States with a correlation coefficient (R) of -0.019 and weighted average of 2.4%, a difference of 1.4%.
Single Father Households Correlation Summary
| Measurement | Welsh | Immigrants from Vietnam |
| Minimum | 1.1% | 0.60% |
| Maximum | 57.1% | 4.9% |
| Range | 56.0% | 4.3% |
| Mean | 8.3% | 2.5% |
| Median | 3.3% | 2.4% |
| Interquartile 25% (IQ1) | 2.6% | 2.2% |
| Interquartile 75% (IQ3) | 7.5% | 2.8% |
| Interquartile Range (IQR) | 4.9% | 0.62% |
| Standard Deviation (Sample) | 11.7% | 0.70% |
| Standard Deviation (Population) | 11.5% | 0.70% |
Demographics Similar to Welsh and Immigrants from Vietnam by Single Father Households
In terms of single father households, the demographic groups most similar to Welsh are Yugoslavian (2.3%, a difference of 0.010%), Jamaican (2.3%, a difference of 0.040%), Belgian (2.3%, a difference of 0.060%), Immigrants from Panama (2.4%, a difference of 0.16%), and Sri Lankan (2.4%, a difference of 0.17%). Similarly, the demographic groups most similar to Immigrants from Vietnam are Scandinavian (2.4%, a difference of 0.030%), Kenyan (2.4%, a difference of 0.080%), German (2.4%, a difference of 0.080%), Immigrants from Philippines (2.4%, a difference of 0.14%), and Panamanian (2.4%, a difference of 0.22%).
| Demographics | Rating | Rank | Single Father Households |
| Welsh | 44.0 /100 | #179 | Average 2.3% |
| Yugoslavians | 43.9 /100 | #180 | Average 2.3% |
| Jamaicans | 43.5 /100 | #181 | Average 2.3% |
| Belgians | 43.3 /100 | #182 | Average 2.3% |
| Immigrants | Panama | 41.8 /100 | #183 | Average 2.4% |
| Sri Lankans | 41.8 /100 | #184 | Average 2.4% |
| Nigerians | 41.0 /100 | #185 | Average 2.4% |
| Immigrants | Bosnia and Herzegovina | 40.4 /100 | #186 | Average 2.4% |
| Immigrants | Colombia | 34.0 /100 | #187 | Fair 2.4% |
| Hmong | 33.0 /100 | #188 | Fair 2.4% |
| U.S. Virgin Islanders | 31.8 /100 | #189 | Fair 2.4% |
| French | 31.7 /100 | #190 | Fair 2.4% |
| Immigrants | Africa | 30.0 /100 | #191 | Fair 2.4% |
| Immigrants | Sudan | 29.8 /100 | #192 | Fair 2.4% |
| Uruguayans | 29.7 /100 | #193 | Fair 2.4% |
| Panamanians | 29.6 /100 | #194 | Fair 2.4% |
| Immigrants | Philippines | 28.7 /100 | #195 | Fair 2.4% |
| Kenyans | 28.0 /100 | #196 | Fair 2.4% |
| Germans | 28.0 /100 | #197 | Fair 2.4% |
| Scandinavians | 27.4 /100 | #198 | Fair 2.4% |
| Immigrants | Vietnam | 27.1 /100 | #199 | Fair 2.4% |