Welsh vs Immigrants from North Macedonia Single Father Households
COMPARE
Welsh
Immigrants from North Macedonia
Single Father Households
Single Father Households Comparison
Welsh
Immigrants from North Macedonia
2.3%
SINGLE FATHER HOUSEHOLDS
44.0/ 100
METRIC RATING
179th/ 347
METRIC RANK
2.0%
SINGLE FATHER HOUSEHOLDS
99.9/ 100
METRIC RATING
59th/ 347
METRIC RANK
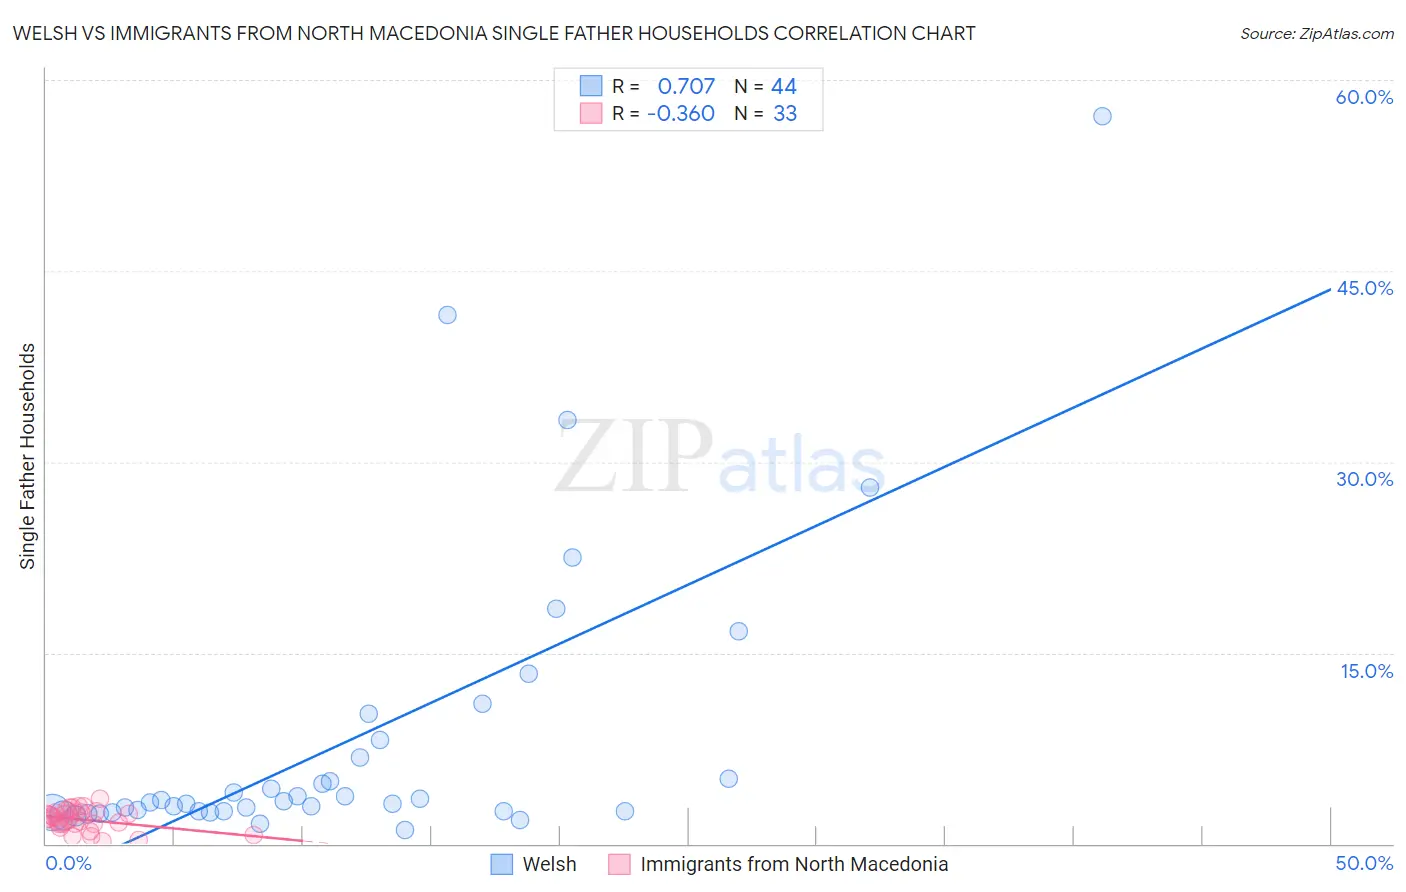
Welsh vs Immigrants from North Macedonia Single Father Households Correlation Chart
The statistical analysis conducted on geographies consisting of 518,370,143 people shows a strong positive correlation between the proportion of Welsh and percentage of single father households in the United States with a correlation coefficient (R) of 0.707 and weighted average of 2.3%. Similarly, the statistical analysis conducted on geographies consisting of 74,159,006 people shows a mild negative correlation between the proportion of Immigrants from North Macedonia and percentage of single father households in the United States with a correlation coefficient (R) of -0.360 and weighted average of 2.0%, a difference of 15.3%.
Single Father Households Correlation Summary
| Measurement | Welsh | Immigrants from North Macedonia |
| Minimum | 1.1% | 0.24% |
| Maximum | 57.1% | 3.5% |
| Range | 56.0% | 3.2% |
| Mean | 8.3% | 1.9% |
| Median | 3.3% | 2.0% |
| Interquartile 25% (IQ1) | 2.6% | 1.6% |
| Interquartile 75% (IQ3) | 7.5% | 2.5% |
| Interquartile Range (IQR) | 4.9% | 0.92% |
| Standard Deviation (Sample) | 11.7% | 0.81% |
| Standard Deviation (Population) | 11.5% | 0.80% |
Similar Demographics by Single Father Households
Demographics Similar to Welsh by Single Father Households
In terms of single father households, the demographic groups most similar to Welsh are Costa Rican (2.3%, a difference of 0.0%), Yugoslavian (2.3%, a difference of 0.010%), Jamaican (2.3%, a difference of 0.040%), Belgian (2.3%, a difference of 0.060%), and Immigrants from Panama (2.4%, a difference of 0.16%).
| Demographics | Rating | Rank | Single Father Households |
| Czechoslovakians | 58.9 /100 | #172 | Average 2.3% |
| Celtics | 55.4 /100 | #173 | Average 2.3% |
| Afghans | 50.0 /100 | #174 | Average 2.3% |
| Immigrants | Jamaica | 49.1 /100 | #175 | Average 2.3% |
| Danes | 48.2 /100 | #176 | Average 2.3% |
| Colombians | 48.0 /100 | #177 | Average 2.3% |
| Costa Ricans | 44.1 /100 | #178 | Average 2.3% |
| Welsh | 44.0 /100 | #179 | Average 2.3% |
| Yugoslavians | 43.9 /100 | #180 | Average 2.3% |
| Jamaicans | 43.5 /100 | #181 | Average 2.3% |
| Belgians | 43.3 /100 | #182 | Average 2.3% |
| Immigrants | Panama | 41.8 /100 | #183 | Average 2.4% |
| Sri Lankans | 41.8 /100 | #184 | Average 2.4% |
| Nigerians | 41.0 /100 | #185 | Average 2.4% |
| Immigrants | Bosnia and Herzegovina | 40.4 /100 | #186 | Average 2.4% |
Demographics Similar to Immigrants from North Macedonia by Single Father Households
In terms of single father households, the demographic groups most similar to Immigrants from North Macedonia are Immigrants from Austria (2.0%, a difference of 0.010%), Immigrants from Czechoslovakia (2.0%, a difference of 0.11%), Burmese (2.0%, a difference of 0.13%), Vietnamese (2.0%, a difference of 0.25%), and Immigrants from Norway (2.0%, a difference of 0.39%).
| Demographics | Rating | Rank | Single Father Households |
| Immigrants | Europe | 99.9 /100 | #52 | Exceptional 2.0% |
| Immigrants | Northern Europe | 99.9 /100 | #53 | Exceptional 2.0% |
| Immigrants | Korea | 99.9 /100 | #54 | Exceptional 2.0% |
| Immigrants | France | 99.9 /100 | #55 | Exceptional 2.0% |
| Immigrants | Norway | 99.9 /100 | #56 | Exceptional 2.0% |
| Burmese | 99.9 /100 | #57 | Exceptional 2.0% |
| Immigrants | Czechoslovakia | 99.9 /100 | #58 | Exceptional 2.0% |
| Immigrants | North Macedonia | 99.9 /100 | #59 | Exceptional 2.0% |
| Immigrants | Austria | 99.9 /100 | #60 | Exceptional 2.0% |
| Vietnamese | 99.9 /100 | #61 | Exceptional 2.0% |
| Immigrants | Malaysia | 99.9 /100 | #62 | Exceptional 2.0% |
| Maltese | 99.9 /100 | #63 | Exceptional 2.0% |
| Mongolians | 99.9 /100 | #64 | Exceptional 2.1% |
| Paraguayans | 99.9 /100 | #65 | Exceptional 2.1% |
| Immigrants | Western Asia | 99.8 /100 | #66 | Exceptional 2.1% |