Filipino vs Slovak Single Father Households
COMPARE
Filipino
Slovak
Single Father Households
Single Father Households Comparison
Filipinos
Slovaks
1.8%
SINGLE FATHER HOUSEHOLDS
100.0/ 100
METRIC RATING
3rd/ 347
METRIC RANK
2.2%
SINGLE FATHER HOUSEHOLDS
90.7/ 100
METRIC RATING
144th/ 347
METRIC RANK
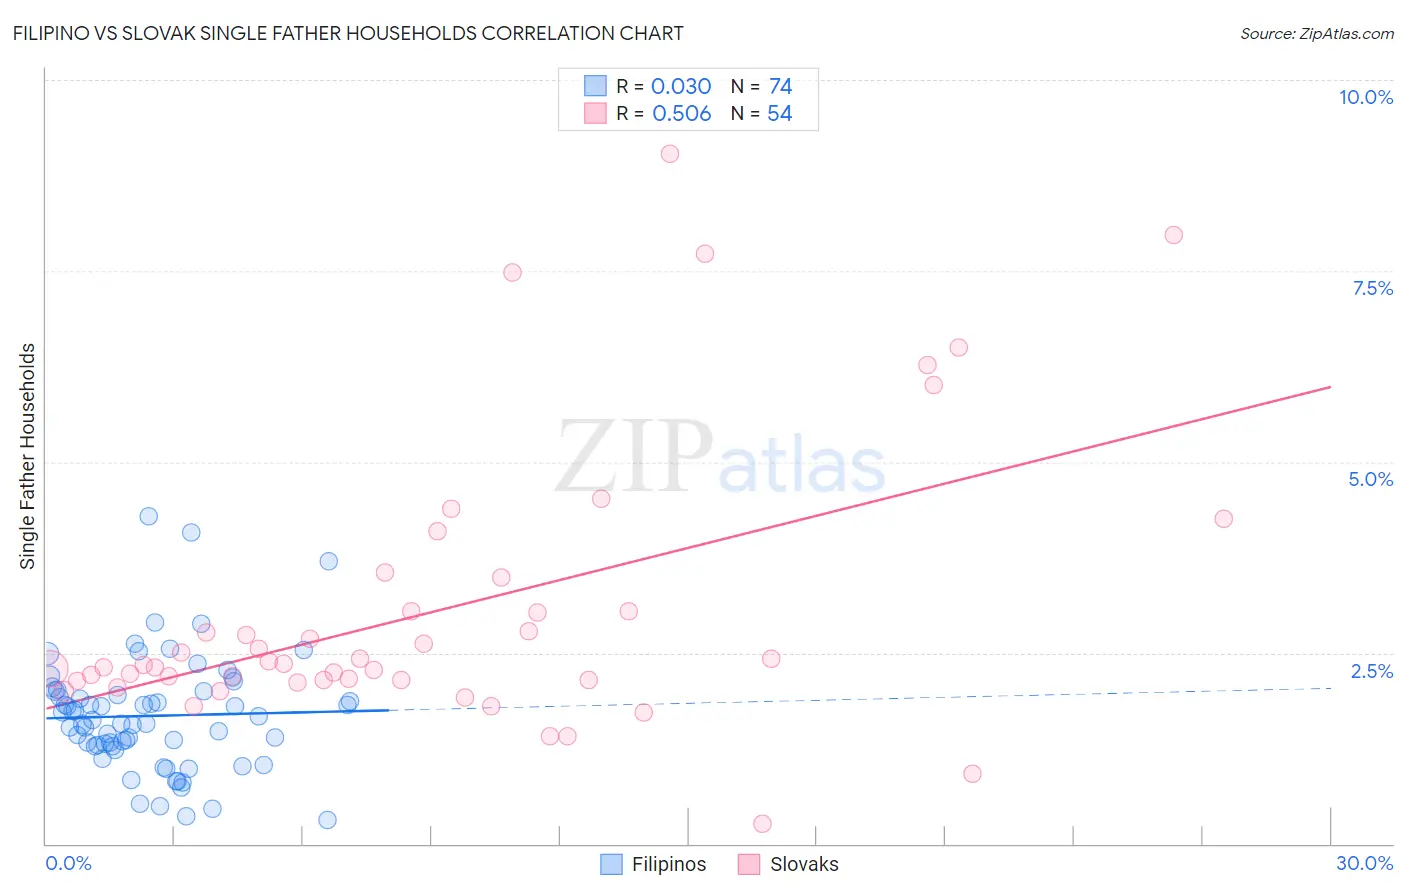
Filipino vs Slovak Single Father Households Correlation Chart
The statistical analysis conducted on geographies consisting of 252,994,105 people shows no correlation between the proportion of Filipinos and percentage of single father households in the United States with a correlation coefficient (R) of 0.030 and weighted average of 1.8%. Similarly, the statistical analysis conducted on geographies consisting of 393,166,504 people shows a substantial positive correlation between the proportion of Slovaks and percentage of single father households in the United States with a correlation coefficient (R) of 0.506 and weighted average of 2.2%, a difference of 24.2%.
Single Father Households Correlation Summary
| Measurement | Filipino | Slovak |
| Minimum | 0.31% | 0.26% |
| Maximum | 4.3% | 9.0% |
| Range | 4.0% | 8.8% |
| Mean | 1.7% | 3.1% |
| Median | 1.6% | 2.3% |
| Interquartile 25% (IQ1) | 1.3% | 2.1% |
| Interquartile 75% (IQ3) | 2.0% | 3.0% |
| Interquartile Range (IQR) | 0.72% | 0.91% |
| Standard Deviation (Sample) | 0.76% | 1.8% |
| Standard Deviation (Population) | 0.75% | 1.8% |
Similar Demographics by Single Father Households
Demographics Similar to Filipinos by Single Father Households
In terms of single father households, the demographic groups most similar to Filipinos are Immigrants from Israel (1.8%, a difference of 0.42%), Soviet Union (1.8%, a difference of 0.46%), Immigrants from Uzbekistan (1.8%, a difference of 0.66%), Immigrants from Hong Kong (1.8%, a difference of 1.6%), and Immigrants from Taiwan (1.8%, a difference of 2.0%).
| Demographics | Rating | Rank | Single Father Households |
| Soviet Union | 100.0 /100 | #1 | Exceptional 1.8% |
| Immigrants | Israel | 100.0 /100 | #2 | Exceptional 1.8% |
| Filipinos | 100.0 /100 | #3 | Exceptional 1.8% |
| Immigrants | Uzbekistan | 100.0 /100 | #4 | Exceptional 1.8% |
| Immigrants | Hong Kong | 100.0 /100 | #5 | Exceptional 1.8% |
| Immigrants | Taiwan | 100.0 /100 | #6 | Exceptional 1.8% |
| Cypriots | 100.0 /100 | #7 | Exceptional 1.8% |
| Immigrants | Ireland | 100.0 /100 | #8 | Exceptional 1.8% |
| Immigrants | China | 100.0 /100 | #9 | Exceptional 1.8% |
| Okinawans | 100.0 /100 | #10 | Exceptional 1.9% |
| Immigrants | Belarus | 100.0 /100 | #11 | Exceptional 1.9% |
| Immigrants | Greece | 100.0 /100 | #12 | Exceptional 1.9% |
| Immigrants | Singapore | 100.0 /100 | #13 | Exceptional 1.9% |
| Immigrants | Lithuania | 100.0 /100 | #14 | Exceptional 1.9% |
| Immigrants | Eastern Asia | 100.0 /100 | #15 | Exceptional 1.9% |
Demographics Similar to Slovaks by Single Father Households
In terms of single father households, the demographic groups most similar to Slovaks are Immigrants from Zimbabwe (2.2%, a difference of 0.11%), Northern European (2.2%, a difference of 0.19%), Immigrants from Nepal (2.2%, a difference of 0.34%), Slavic (2.2%, a difference of 0.37%), and Luxembourger (2.2%, a difference of 0.40%).
| Demographics | Rating | Rank | Single Father Households |
| Austrians | 94.2 /100 | #137 | Exceptional 2.2% |
| West Indians | 94.1 /100 | #138 | Exceptional 2.2% |
| Brazilians | 92.8 /100 | #139 | Exceptional 2.2% |
| British | 92.8 /100 | #140 | Exceptional 2.2% |
| Laotians | 92.5 /100 | #141 | Exceptional 2.2% |
| Luxembourgers | 92.3 /100 | #142 | Exceptional 2.2% |
| Immigrants | Nepal | 92.1 /100 | #143 | Exceptional 2.2% |
| Slovaks | 90.7 /100 | #144 | Exceptional 2.2% |
| Immigrants | Zimbabwe | 90.2 /100 | #145 | Exceptional 2.2% |
| Northern Europeans | 89.8 /100 | #146 | Excellent 2.2% |
| Slavs | 88.9 /100 | #147 | Excellent 2.2% |
| South American Indians | 88.5 /100 | #148 | Excellent 2.3% |
| Senegalese | 88.4 /100 | #149 | Excellent 2.3% |
| Venezuelans | 86.2 /100 | #150 | Excellent 2.3% |
| Immigrants | Syria | 84.8 /100 | #151 | Excellent 2.3% |