Immigrants from Senegal vs Slovak Single Father Households
COMPARE
Immigrants from Senegal
Slovak
Single Father Households
Single Father Households Comparison
Immigrants from Senegal
Slovaks
2.3%
SINGLE FATHER HOUSEHOLDS
79.4/ 100
METRIC RATING
158th/ 347
METRIC RANK
2.2%
SINGLE FATHER HOUSEHOLDS
90.7/ 100
METRIC RATING
144th/ 347
METRIC RANK
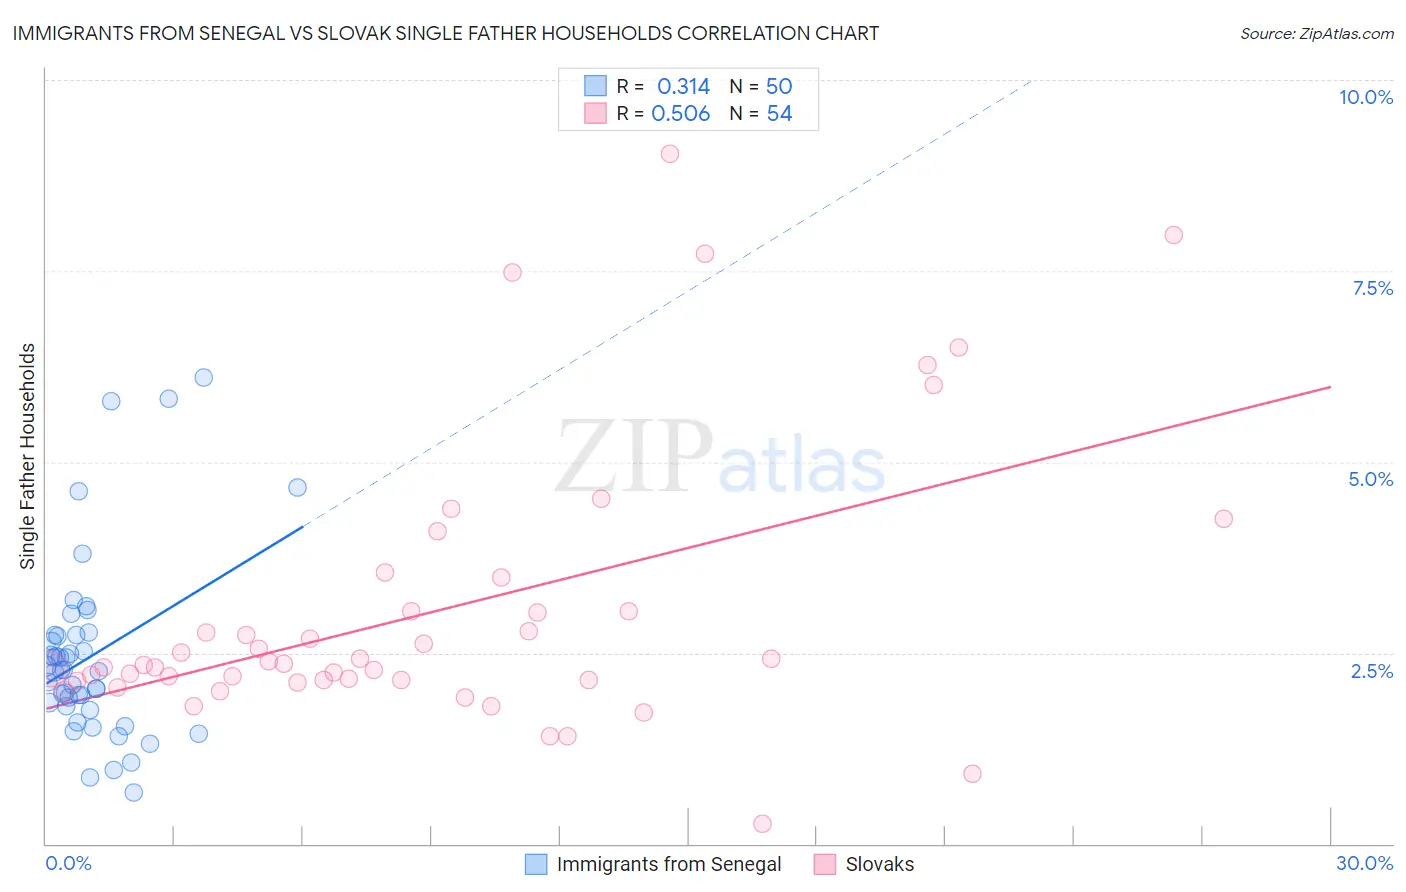
Immigrants from Senegal vs Slovak Single Father Households Correlation Chart
The statistical analysis conducted on geographies consisting of 90,010,834 people shows a mild positive correlation between the proportion of Immigrants from Senegal and percentage of single father households in the United States with a correlation coefficient (R) of 0.314 and weighted average of 2.3%. Similarly, the statistical analysis conducted on geographies consisting of 393,166,504 people shows a substantial positive correlation between the proportion of Slovaks and percentage of single father households in the United States with a correlation coefficient (R) of 0.506 and weighted average of 2.2%, a difference of 1.8%.
Single Father Households Correlation Summary
| Measurement | Immigrants from Senegal | Slovak |
| Minimum | 0.67% | 0.26% |
| Maximum | 6.1% | 9.0% |
| Range | 5.4% | 8.8% |
| Mean | 2.5% | 3.1% |
| Median | 2.3% | 2.3% |
| Interquartile 25% (IQ1) | 1.8% | 2.1% |
| Interquartile 75% (IQ3) | 2.7% | 3.0% |
| Interquartile Range (IQR) | 0.93% | 0.91% |
| Standard Deviation (Sample) | 1.2% | 1.8% |
| Standard Deviation (Population) | 1.2% | 1.8% |
Demographics Similar to Immigrants from Senegal and Slovaks by Single Father Households
In terms of single father households, the demographic groups most similar to Immigrants from Senegal are Canadian (2.3%, a difference of 0.030%), Immigrants from South America (2.3%, a difference of 0.050%), European (2.3%, a difference of 0.17%), Immigrants from West Indies (2.3%, a difference of 0.17%), and Bolivian (2.3%, a difference of 0.19%). Similarly, the demographic groups most similar to Slovaks are Immigrants from Zimbabwe (2.2%, a difference of 0.11%), Northern European (2.2%, a difference of 0.19%), Immigrants from Nepal (2.2%, a difference of 0.34%), Slavic (2.2%, a difference of 0.37%), and Luxembourger (2.2%, a difference of 0.40%).
| Demographics | Rating | Rank | Single Father Households |
| Laotians | 92.5 /100 | #141 | Exceptional 2.2% |
| Luxembourgers | 92.3 /100 | #142 | Exceptional 2.2% |
| Immigrants | Nepal | 92.1 /100 | #143 | Exceptional 2.2% |
| Slovaks | 90.7 /100 | #144 | Exceptional 2.2% |
| Immigrants | Zimbabwe | 90.2 /100 | #145 | Exceptional 2.2% |
| Northern Europeans | 89.8 /100 | #146 | Excellent 2.2% |
| Slavs | 88.9 /100 | #147 | Excellent 2.2% |
| South American Indians | 88.5 /100 | #148 | Excellent 2.3% |
| Senegalese | 88.4 /100 | #149 | Excellent 2.3% |
| Venezuelans | 86.2 /100 | #150 | Excellent 2.3% |
| Immigrants | Syria | 84.8 /100 | #151 | Excellent 2.3% |
| Immigrants | Venezuela | 83.2 /100 | #152 | Excellent 2.3% |
| Immigrants | Germany | 82.8 /100 | #153 | Excellent 2.3% |
| Bolivians | 81.0 /100 | #154 | Excellent 2.3% |
| Europeans | 80.9 /100 | #155 | Excellent 2.3% |
| Immigrants | South America | 79.9 /100 | #156 | Good 2.3% |
| Canadians | 79.7 /100 | #157 | Good 2.3% |
| Immigrants | Senegal | 79.4 /100 | #158 | Good 2.3% |
| Immigrants | West Indies | 77.9 /100 | #159 | Good 2.3% |
| Immigrants | Bolivia | 76.3 /100 | #160 | Good 2.3% |
| Swiss | 73.2 /100 | #161 | Good 2.3% |