Immigrants from Indonesia vs Slovak Single Father Households
COMPARE
Immigrants from Indonesia
Slovak
Single Father Households
Single Father Households Comparison
Immigrants from Indonesia
Slovaks
2.2%
SINGLE FATHER HOUSEHOLDS
97.4/ 100
METRIC RATING
125th/ 347
METRIC RANK
2.2%
SINGLE FATHER HOUSEHOLDS
90.7/ 100
METRIC RATING
144th/ 347
METRIC RANK
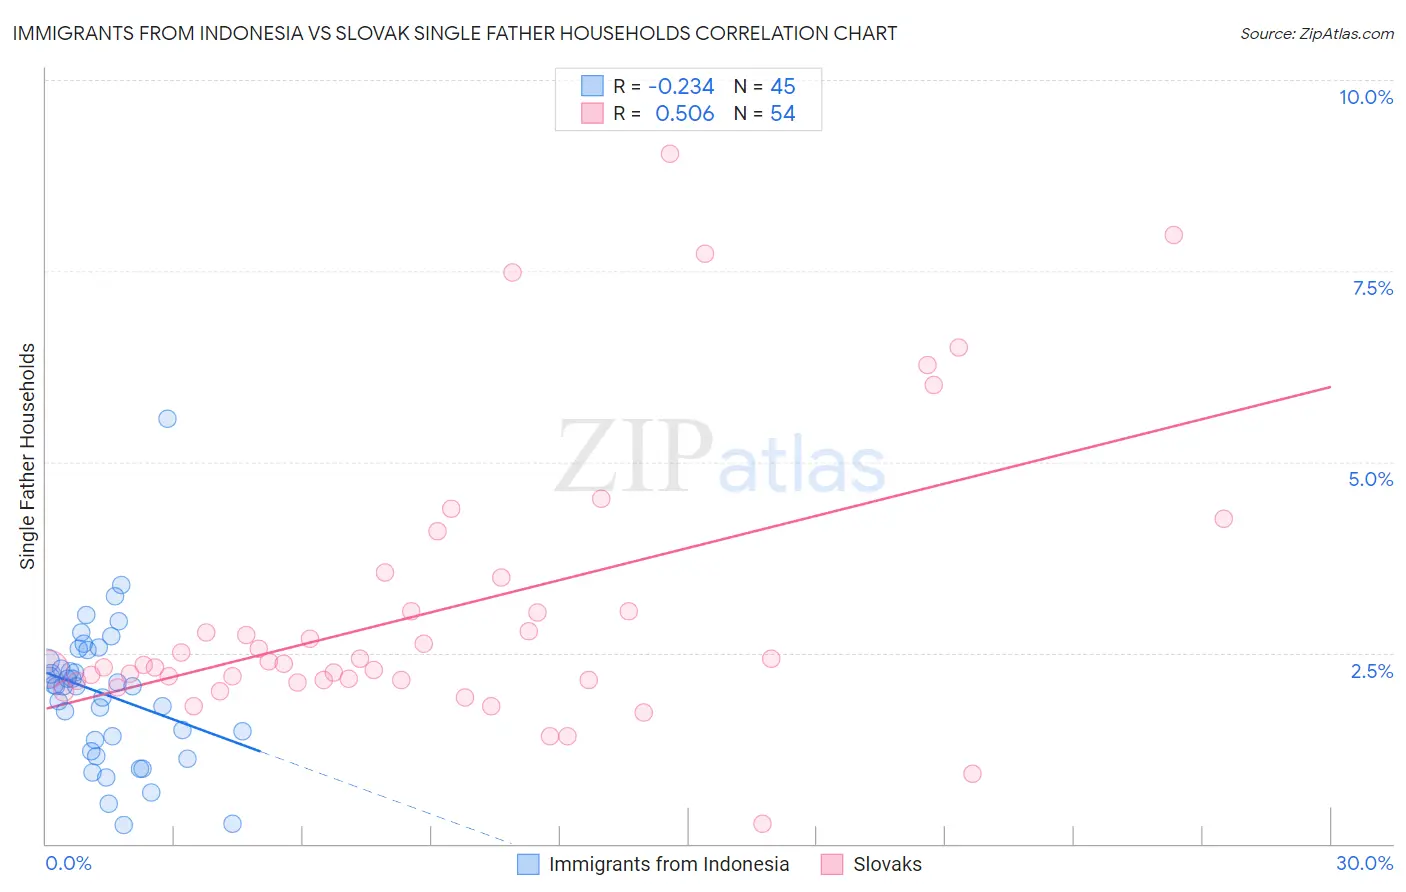
Immigrants from Indonesia vs Slovak Single Father Households Correlation Chart
The statistical analysis conducted on geographies consisting of 214,943,478 people shows a weak negative correlation between the proportion of Immigrants from Indonesia and percentage of single father households in the United States with a correlation coefficient (R) of -0.234 and weighted average of 2.2%. Similarly, the statistical analysis conducted on geographies consisting of 393,166,504 people shows a substantial positive correlation between the proportion of Slovaks and percentage of single father households in the United States with a correlation coefficient (R) of 0.506 and weighted average of 2.2%, a difference of 2.6%.
Single Father Households Correlation Summary
| Measurement | Immigrants from Indonesia | Slovak |
| Minimum | 0.25% | 0.26% |
| Maximum | 5.6% | 9.0% |
| Range | 5.3% | 8.8% |
| Mean | 2.0% | 3.1% |
| Median | 2.1% | 2.3% |
| Interquartile 25% (IQ1) | 1.3% | 2.1% |
| Interquartile 75% (IQ3) | 2.5% | 3.0% |
| Interquartile Range (IQR) | 1.2% | 0.91% |
| Standard Deviation (Sample) | 0.94% | 1.8% |
| Standard Deviation (Population) | 0.93% | 1.8% |
Demographics Similar to Immigrants from Indonesia and Slovaks by Single Father Households
In terms of single father households, the demographic groups most similar to Immigrants from Indonesia are British West Indian (2.2%, a difference of 0.050%), Moroccan (2.2%, a difference of 0.31%), Jordanian (2.2%, a difference of 0.31%), Immigrants from England (2.2%, a difference of 0.36%), and Serbian (2.2%, a difference of 0.37%). Similarly, the demographic groups most similar to Slovaks are Immigrants from Nepal (2.2%, a difference of 0.34%), Luxembourger (2.2%, a difference of 0.40%), Laotian (2.2%, a difference of 0.44%), British (2.2%, a difference of 0.53%), and Brazilian (2.2%, a difference of 0.54%).
| Demographics | Rating | Rank | Single Father Households |
| British West Indians | 97.4 /100 | #124 | Exceptional 2.2% |
| Immigrants | Indonesia | 97.4 /100 | #125 | Exceptional 2.2% |
| Moroccans | 96.9 /100 | #126 | Exceptional 2.2% |
| Jordanians | 96.9 /100 | #127 | Exceptional 2.2% |
| Immigrants | England | 96.8 /100 | #128 | Exceptional 2.2% |
| Serbians | 96.8 /100 | #129 | Exceptional 2.2% |
| Immigrants | Chile | 96.7 /100 | #130 | Exceptional 2.2% |
| Immigrants | Jordan | 96.6 /100 | #131 | Exceptional 2.2% |
| Poles | 96.5 /100 | #132 | Exceptional 2.2% |
| Taiwanese | 96.3 /100 | #133 | Exceptional 2.2% |
| Zimbabweans | 95.1 /100 | #134 | Exceptional 2.2% |
| Syrians | 94.8 /100 | #135 | Exceptional 2.2% |
| Chileans | 94.5 /100 | #136 | Exceptional 2.2% |
| Austrians | 94.2 /100 | #137 | Exceptional 2.2% |
| West Indians | 94.1 /100 | #138 | Exceptional 2.2% |
| Brazilians | 92.8 /100 | #139 | Exceptional 2.2% |
| British | 92.8 /100 | #140 | Exceptional 2.2% |
| Laotians | 92.5 /100 | #141 | Exceptional 2.2% |
| Luxembourgers | 92.3 /100 | #142 | Exceptional 2.2% |
| Immigrants | Nepal | 92.1 /100 | #143 | Exceptional 2.2% |
| Slovaks | 90.7 /100 | #144 | Exceptional 2.2% |