Welsh vs Immigrants from Vietnam 2nd Grade
COMPARE
Welsh
Immigrants from Vietnam
2nd Grade
2nd Grade Comparison
Welsh
Immigrants from Vietnam
98.5%
2ND GRADE
100.0/ 100
METRIC RATING
26th/ 347
METRIC RANK
96.5%
2ND GRADE
0.0/ 100
METRIC RATING
327th/ 347
METRIC RANK
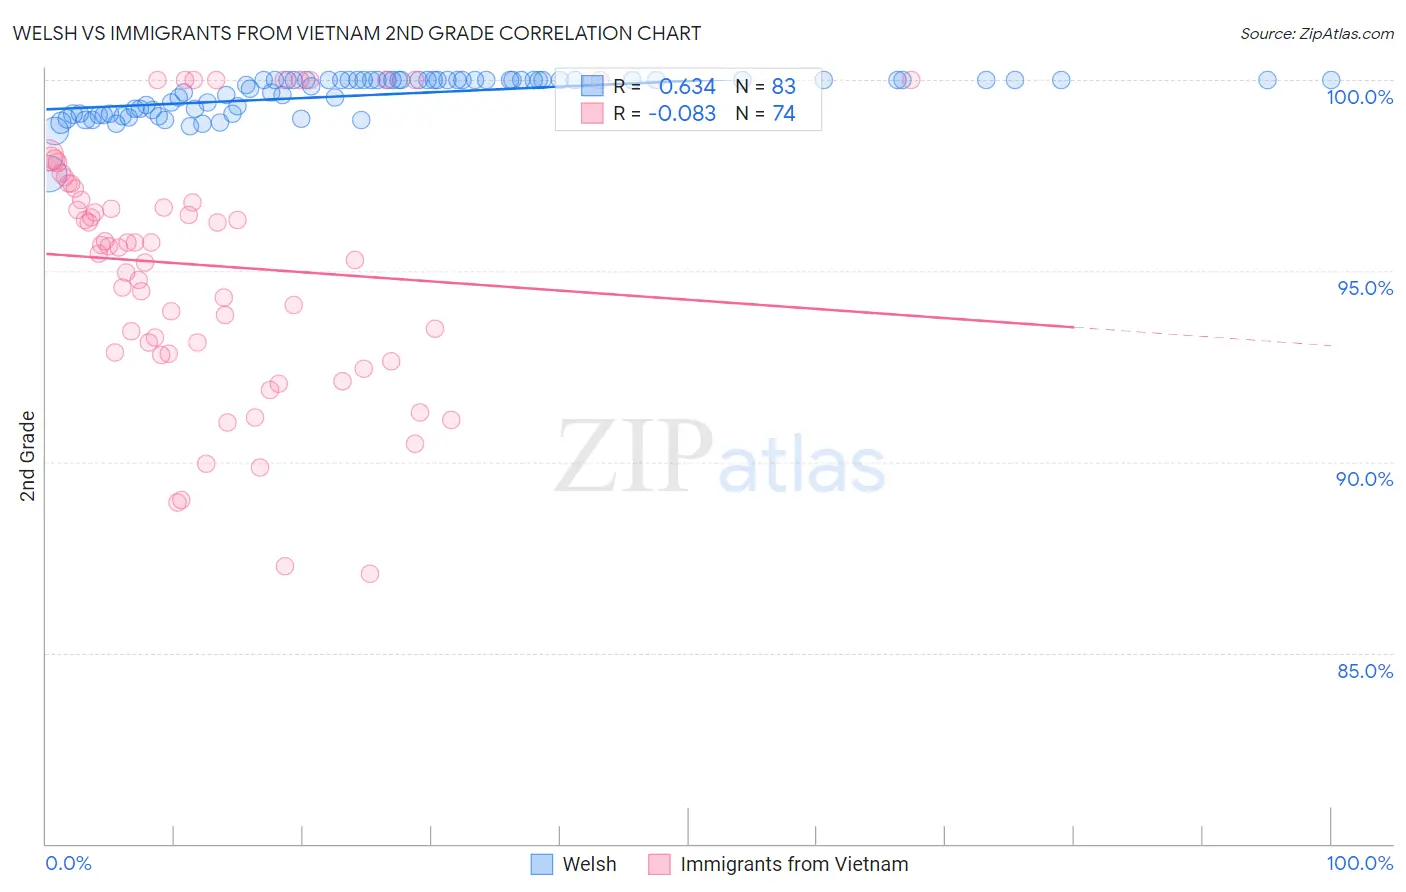
Welsh vs Immigrants from Vietnam 2nd Grade Correlation Chart
The statistical analysis conducted on geographies consisting of 528,593,932 people shows a significant positive correlation between the proportion of Welsh and percentage of population with at least 2nd grade education in the United States with a correlation coefficient (R) of 0.634 and weighted average of 98.5%. Similarly, the statistical analysis conducted on geographies consisting of 404,844,130 people shows a slight negative correlation between the proportion of Immigrants from Vietnam and percentage of population with at least 2nd grade education in the United States with a correlation coefficient (R) of -0.083 and weighted average of 96.5%, a difference of 2.1%.
2nd Grade Correlation Summary
| Measurement | Welsh | Immigrants from Vietnam |
| Minimum | 97.5% | 87.1% |
| Maximum | 100.0% | 100.0% |
| Range | 2.5% | 12.9% |
| Mean | 99.6% | 95.1% |
| Median | 100.0% | 95.7% |
| Interquartile 25% (IQ1) | 99.1% | 92.9% |
| Interquartile 75% (IQ3) | 100.0% | 97.3% |
| Interquartile Range (IQR) | 0.88% | 4.4% |
| Standard Deviation (Sample) | 0.50% | 3.2% |
| Standard Deviation (Population) | 0.50% | 3.2% |
Similar Demographics by 2nd Grade
Demographics Similar to Welsh by 2nd Grade
In terms of 2nd grade, the demographic groups most similar to Welsh are Scotch-Irish (98.5%, a difference of 0.010%), Croatian (98.5%, a difference of 0.010%), Arapaho (98.5%, a difference of 0.010%), French (98.5%, a difference of 0.010%), and Finnish (98.5%, a difference of 0.020%).
| Demographics | Rating | Rank | 2nd Grade |
| Finns | 100.0 /100 | #19 | Exceptional 98.5% |
| Sioux | 100.0 /100 | #20 | Exceptional 98.5% |
| Lithuanians | 100.0 /100 | #21 | Exceptional 98.5% |
| Poles | 100.0 /100 | #22 | Exceptional 98.5% |
| Danes | 100.0 /100 | #23 | Exceptional 98.5% |
| Pennsylvania Germans | 100.0 /100 | #24 | Exceptional 98.5% |
| Scotch-Irish | 100.0 /100 | #25 | Exceptional 98.5% |
| Welsh | 100.0 /100 | #26 | Exceptional 98.5% |
| Croatians | 100.0 /100 | #27 | Exceptional 98.5% |
| Arapaho | 100.0 /100 | #28 | Exceptional 98.5% |
| French | 100.0 /100 | #29 | Exceptional 98.5% |
| Europeans | 100.0 /100 | #30 | Exceptional 98.5% |
| Czechs | 100.0 /100 | #31 | Exceptional 98.5% |
| French Canadians | 100.0 /100 | #32 | Exceptional 98.5% |
| Scandinavians | 100.0 /100 | #33 | Exceptional 98.5% |
Demographics Similar to Immigrants from Vietnam by 2nd Grade
In terms of 2nd grade, the demographic groups most similar to Immigrants from Vietnam are Mexican (96.5%, a difference of 0.0%), Japanese (96.5%, a difference of 0.010%), Immigrants from Latin America (96.5%, a difference of 0.010%), Immigrants from Armenia (96.5%, a difference of 0.050%), and Bangladeshi (96.5%, a difference of 0.060%).
| Demographics | Rating | Rank | 2nd Grade |
| Immigrants | Guyana | 0.0 /100 | #320 | Tragic 96.7% |
| Immigrants | Burma/Myanmar | 0.0 /100 | #321 | Tragic 96.7% |
| Immigrants | Bangladesh | 0.0 /100 | #322 | Tragic 96.7% |
| Vietnamese | 0.0 /100 | #323 | Tragic 96.7% |
| Mexican American Indians | 0.0 /100 | #324 | Tragic 96.7% |
| Dominicans | 0.0 /100 | #325 | Tragic 96.6% |
| Immigrants | Honduras | 0.0 /100 | #326 | Tragic 96.6% |
| Immigrants | Vietnam | 0.0 /100 | #327 | Tragic 96.5% |
| Mexicans | 0.0 /100 | #328 | Tragic 96.5% |
| Japanese | 0.0 /100 | #329 | Tragic 96.5% |
| Immigrants | Latin America | 0.0 /100 | #330 | Tragic 96.5% |
| Immigrants | Armenia | 0.0 /100 | #331 | Tragic 96.5% |
| Bangladeshis | 0.0 /100 | #332 | Tragic 96.5% |
| Immigrants | Dominican Republic | 0.0 /100 | #333 | Tragic 96.4% |
| Central Americans | 0.0 /100 | #334 | Tragic 96.4% |