Estonian vs Immigrants from Vietnam Single Father Households
COMPARE
Estonian
Immigrants from Vietnam
Single Father Households
Single Father Households Comparison
Estonians
Immigrants from Vietnam
2.1%
SINGLE FATHER HOUSEHOLDS
99.7/ 100
METRIC RATING
78th/ 347
METRIC RANK
2.4%
SINGLE FATHER HOUSEHOLDS
27.1/ 100
METRIC RATING
199th/ 347
METRIC RANK
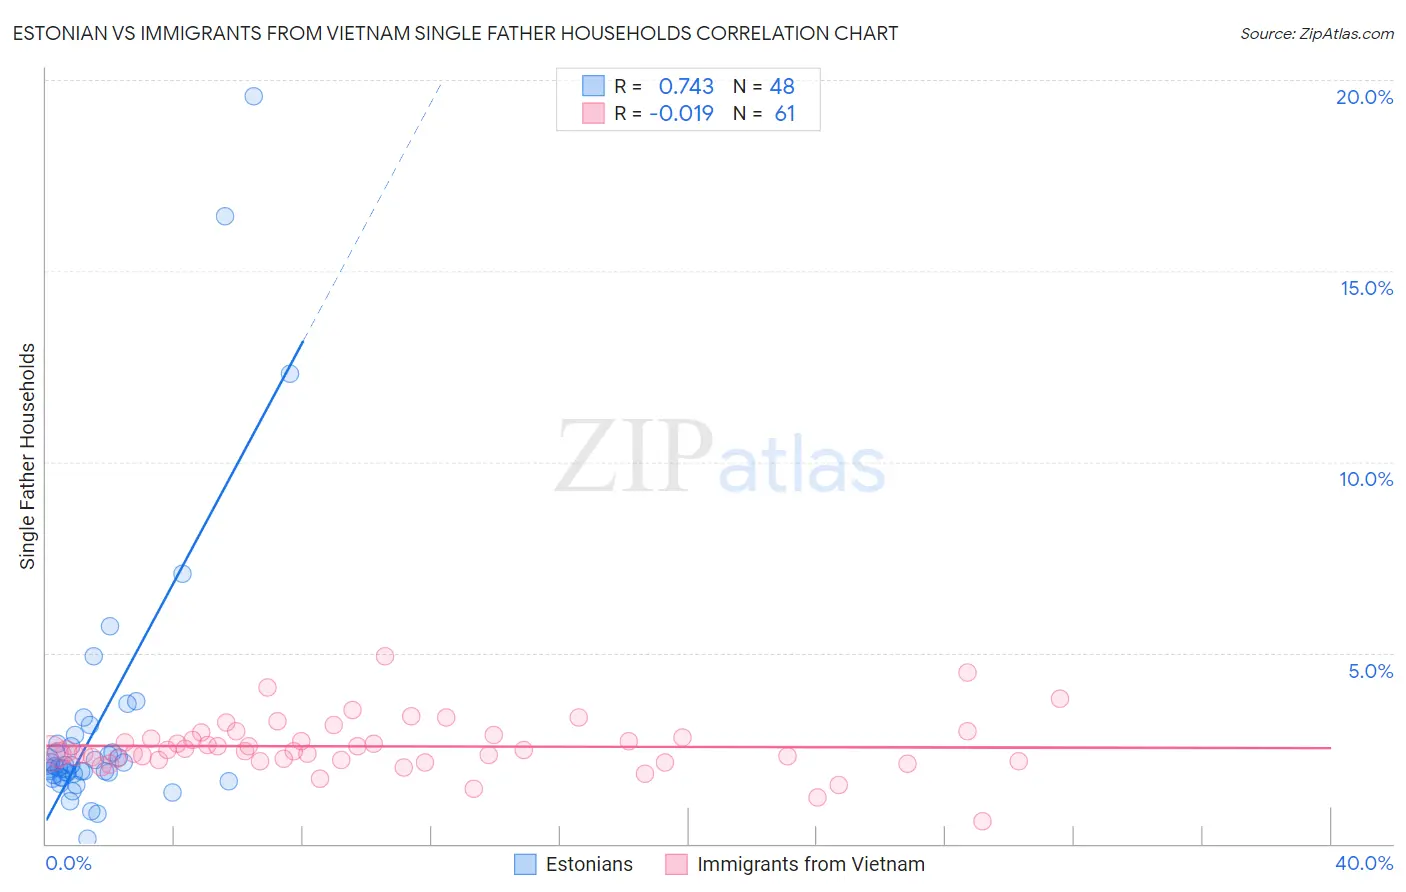
Estonian vs Immigrants from Vietnam Single Father Households Correlation Chart
The statistical analysis conducted on geographies consisting of 123,065,759 people shows a strong positive correlation between the proportion of Estonians and percentage of single father households in the United States with a correlation coefficient (R) of 0.743 and weighted average of 2.1%. Similarly, the statistical analysis conducted on geographies consisting of 401,755,034 people shows no correlation between the proportion of Immigrants from Vietnam and percentage of single father households in the United States with a correlation coefficient (R) of -0.019 and weighted average of 2.4%, a difference of 14.2%.
Single Father Households Correlation Summary
| Measurement | Estonian | Immigrants from Vietnam |
| Minimum | 0.12% | 0.60% |
| Maximum | 19.6% | 4.9% |
| Range | 19.5% | 4.3% |
| Mean | 3.1% | 2.5% |
| Median | 2.0% | 2.4% |
| Interquartile 25% (IQ1) | 1.8% | 2.2% |
| Interquartile 75% (IQ3) | 2.6% | 2.8% |
| Interquartile Range (IQR) | 0.82% | 0.62% |
| Standard Deviation (Sample) | 3.7% | 0.70% |
| Standard Deviation (Population) | 3.6% | 0.70% |
Similar Demographics by Single Father Households
Demographics Similar to Estonians by Single Father Households
In terms of single father households, the demographic groups most similar to Estonians are Immigrants from Asia (2.1%, a difference of 0.11%), Immigrants from South Africa (2.1%, a difference of 0.20%), Armenian (2.1%, a difference of 0.28%), Immigrants from Saudi Arabia (2.1%, a difference of 0.31%), and New Zealander (2.1%, a difference of 0.33%).
| Demographics | Rating | Rank | Single Father Households |
| Immigrants | Kuwait | 99.8 /100 | #71 | Exceptional 2.1% |
| Immigrants | Spain | 99.8 /100 | #72 | Exceptional 2.1% |
| Immigrants | Bangladesh | 99.8 /100 | #73 | Exceptional 2.1% |
| Immigrants | Egypt | 99.8 /100 | #74 | Exceptional 2.1% |
| Immigrants | Sweden | 99.8 /100 | #75 | Exceptional 2.1% |
| Immigrants | Scotland | 99.8 /100 | #76 | Exceptional 2.1% |
| Immigrants | Saudi Arabia | 99.8 /100 | #77 | Exceptional 2.1% |
| Estonians | 99.7 /100 | #78 | Exceptional 2.1% |
| Immigrants | Asia | 99.7 /100 | #79 | Exceptional 2.1% |
| Immigrants | South Africa | 99.7 /100 | #80 | Exceptional 2.1% |
| Armenians | 99.7 /100 | #81 | Exceptional 2.1% |
| New Zealanders | 99.7 /100 | #82 | Exceptional 2.1% |
| Greeks | 99.7 /100 | #83 | Exceptional 2.1% |
| Carpatho Rusyns | 99.6 /100 | #84 | Exceptional 2.1% |
| Immigrants | Hungary | 99.6 /100 | #85 | Exceptional 2.1% |
Demographics Similar to Immigrants from Vietnam by Single Father Households
In terms of single father households, the demographic groups most similar to Immigrants from Vietnam are Peruvian (2.4%, a difference of 0.0%), Scandinavian (2.4%, a difference of 0.030%), Kenyan (2.4%, a difference of 0.080%), German (2.4%, a difference of 0.080%), and Immigrants from Uganda (2.4%, a difference of 0.10%).
| Demographics | Rating | Rank | Single Father Households |
| Immigrants | Sudan | 29.8 /100 | #192 | Fair 2.4% |
| Uruguayans | 29.7 /100 | #193 | Fair 2.4% |
| Panamanians | 29.6 /100 | #194 | Fair 2.4% |
| Immigrants | Philippines | 28.7 /100 | #195 | Fair 2.4% |
| Kenyans | 28.0 /100 | #196 | Fair 2.4% |
| Germans | 28.0 /100 | #197 | Fair 2.4% |
| Scandinavians | 27.4 /100 | #198 | Fair 2.4% |
| Immigrants | Vietnam | 27.1 /100 | #199 | Fair 2.4% |
| Peruvians | 27.1 /100 | #200 | Fair 2.4% |
| Immigrants | Uganda | 26.0 /100 | #201 | Fair 2.4% |
| German Russians | 25.7 /100 | #202 | Fair 2.4% |
| French Canadians | 24.7 /100 | #203 | Fair 2.4% |
| Ecuadorians | 24.5 /100 | #204 | Fair 2.4% |
| Immigrants | Afghanistan | 24.2 /100 | #205 | Fair 2.4% |
| Koreans | 24.1 /100 | #206 | Fair 2.4% |