Welsh vs Immigrants from Vietnam 7th Grade
COMPARE
Welsh
Immigrants from Vietnam
7th Grade
7th Grade Comparison
Welsh
Immigrants from Vietnam
97.4%
7TH GRADE
100.0/ 100
METRIC RATING
24th/ 347
METRIC RANK
93.9%
7TH GRADE
0.0/ 100
METRIC RATING
316th/ 347
METRIC RANK
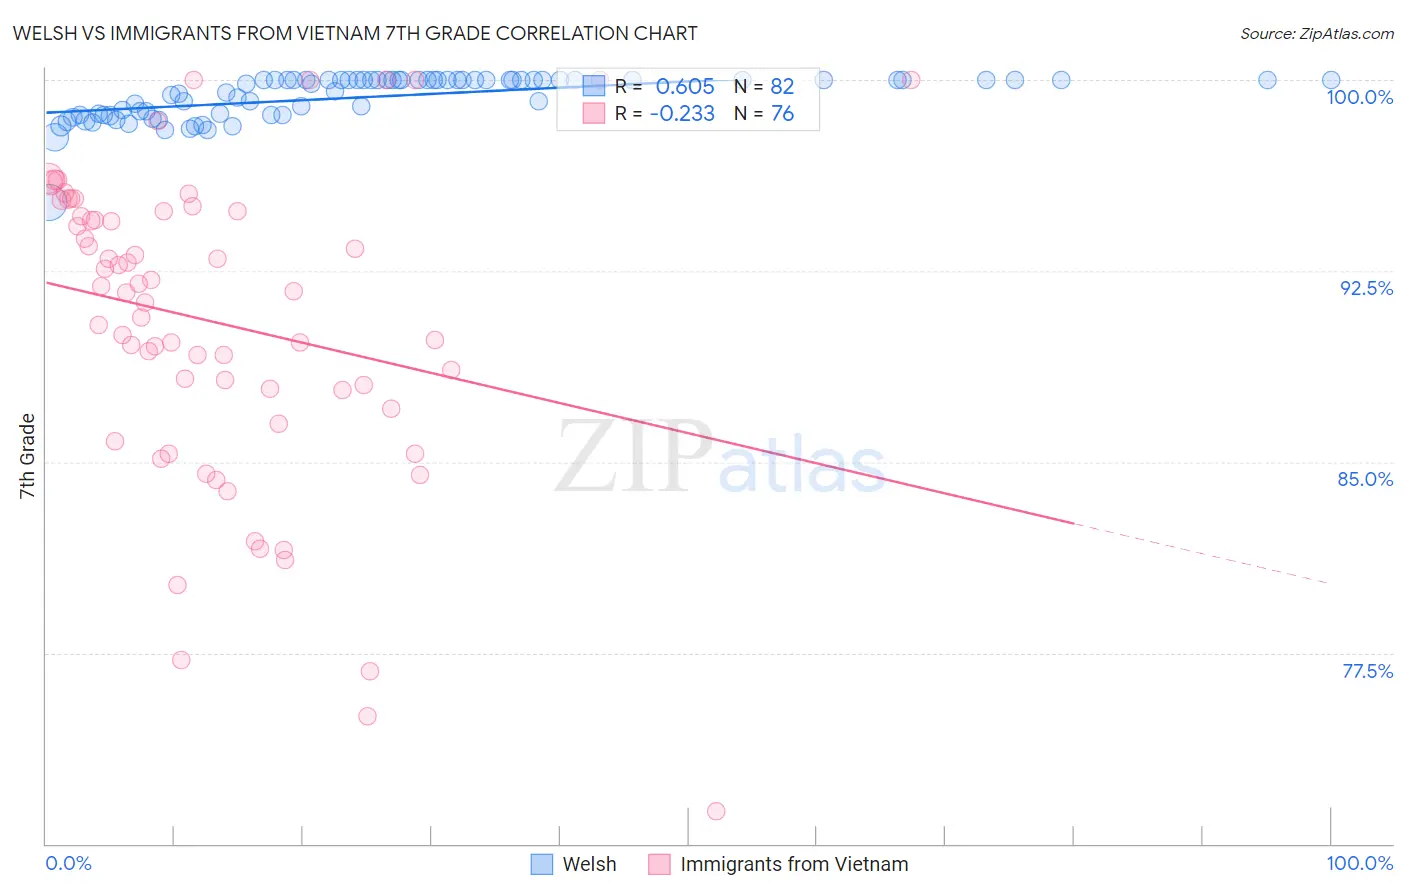
Welsh vs Immigrants from Vietnam 7th Grade Correlation Chart
The statistical analysis conducted on geographies consisting of 528,593,557 people shows a significant positive correlation between the proportion of Welsh and percentage of population with at least 7th grade education in the United States with a correlation coefficient (R) of 0.605 and weighted average of 97.4%. Similarly, the statistical analysis conducted on geographies consisting of 404,844,322 people shows a weak negative correlation between the proportion of Immigrants from Vietnam and percentage of population with at least 7th grade education in the United States with a correlation coefficient (R) of -0.233 and weighted average of 93.9%, a difference of 3.7%.
7th Grade Correlation Summary
| Measurement | Welsh | Immigrants from Vietnam |
| Minimum | 95.2% | 71.3% |
| Maximum | 100.0% | 100.0% |
| Range | 4.8% | 28.7% |
| Mean | 99.3% | 90.5% |
| Median | 100.0% | 91.7% |
| Interquartile 25% (IQ1) | 98.6% | 87.5% |
| Interquartile 75% (IQ3) | 100.0% | 94.9% |
| Interquartile Range (IQR) | 1.4% | 7.4% |
| Standard Deviation (Sample) | 0.87% | 6.1% |
| Standard Deviation (Population) | 0.86% | 6.1% |
Similar Demographics by 7th Grade
Demographics Similar to Welsh by 7th Grade
In terms of 7th grade, the demographic groups most similar to Welsh are French (97.4%, a difference of 0.0%), Croatian (97.4%, a difference of 0.010%), Scotch-Irish (97.4%, a difference of 0.010%), Danish (97.4%, a difference of 0.010%), and Inupiat (97.4%, a difference of 0.030%).
| Demographics | Rating | Rank | 7th Grade |
| Scottish | 100.0 /100 | #17 | Exceptional 97.5% |
| Tlingit-Haida | 100.0 /100 | #18 | Exceptional 97.5% |
| Lithuanians | 100.0 /100 | #19 | Exceptional 97.5% |
| Yup'ik | 100.0 /100 | #20 | Exceptional 97.4% |
| Inupiat | 100.0 /100 | #21 | Exceptional 97.4% |
| French Canadians | 100.0 /100 | #22 | Exceptional 97.4% |
| Croatians | 100.0 /100 | #23 | Exceptional 97.4% |
| Welsh | 100.0 /100 | #24 | Exceptional 97.4% |
| French | 100.0 /100 | #25 | Exceptional 97.4% |
| Scotch-Irish | 100.0 /100 | #26 | Exceptional 97.4% |
| Danes | 100.0 /100 | #27 | Exceptional 97.4% |
| Sioux | 100.0 /100 | #28 | Exceptional 97.4% |
| Scandinavians | 100.0 /100 | #29 | Exceptional 97.4% |
| Czechs | 100.0 /100 | #30 | Exceptional 97.4% |
| Europeans | 100.0 /100 | #31 | Exceptional 97.3% |
Demographics Similar to Immigrants from Vietnam by 7th Grade
In terms of 7th grade, the demographic groups most similar to Immigrants from Vietnam are Vietnamese (93.9%, a difference of 0.030%), Japanese (94.0%, a difference of 0.080%), Immigrants from Cuba (93.8%, a difference of 0.090%), Immigrants (94.0%, a difference of 0.11%), and Immigrants from Bangladesh (94.0%, a difference of 0.11%).
| Demographics | Rating | Rank | 7th Grade |
| Ecuadorians | 0.0 /100 | #309 | Tragic 94.0% |
| Immigrants | Caribbean | 0.0 /100 | #310 | Tragic 94.0% |
| Puerto Ricans | 0.0 /100 | #311 | Tragic 94.0% |
| Immigrants | Immigrants | 0.0 /100 | #312 | Tragic 94.0% |
| Immigrants | Bangladesh | 0.0 /100 | #313 | Tragic 94.0% |
| Japanese | 0.0 /100 | #314 | Tragic 94.0% |
| Vietnamese | 0.0 /100 | #315 | Tragic 93.9% |
| Immigrants | Vietnam | 0.0 /100 | #316 | Tragic 93.9% |
| Immigrants | Cuba | 0.0 /100 | #317 | Tragic 93.8% |
| Immigrants | Ecuador | 0.0 /100 | #318 | Tragic 93.7% |
| Immigrants | Cambodia | 0.0 /100 | #319 | Tragic 93.7% |
| Immigrants | Fiji | 0.0 /100 | #320 | Tragic 93.5% |
| Belizeans | 0.0 /100 | #321 | Tragic 93.5% |
| Nicaraguans | 0.0 /100 | #322 | Tragic 93.5% |
| Immigrants | Belize | 0.0 /100 | #323 | Tragic 93.4% |