Welsh vs Carpatho Rusyn Family Households with Children
COMPARE
Welsh
Carpatho Rusyn
Family Households with Children
Family Households with Children Comparison
Welsh
Carpatho Rusyns
27.2%
FAMILY HOUSEHOLDS WITH CHILDREN
14.2/ 100
METRIC RATING
211th/ 347
METRIC RANK
25.2%
FAMILY HOUSEHOLDS WITH CHILDREN
0.0/ 100
METRIC RATING
346th/ 347
METRIC RANK
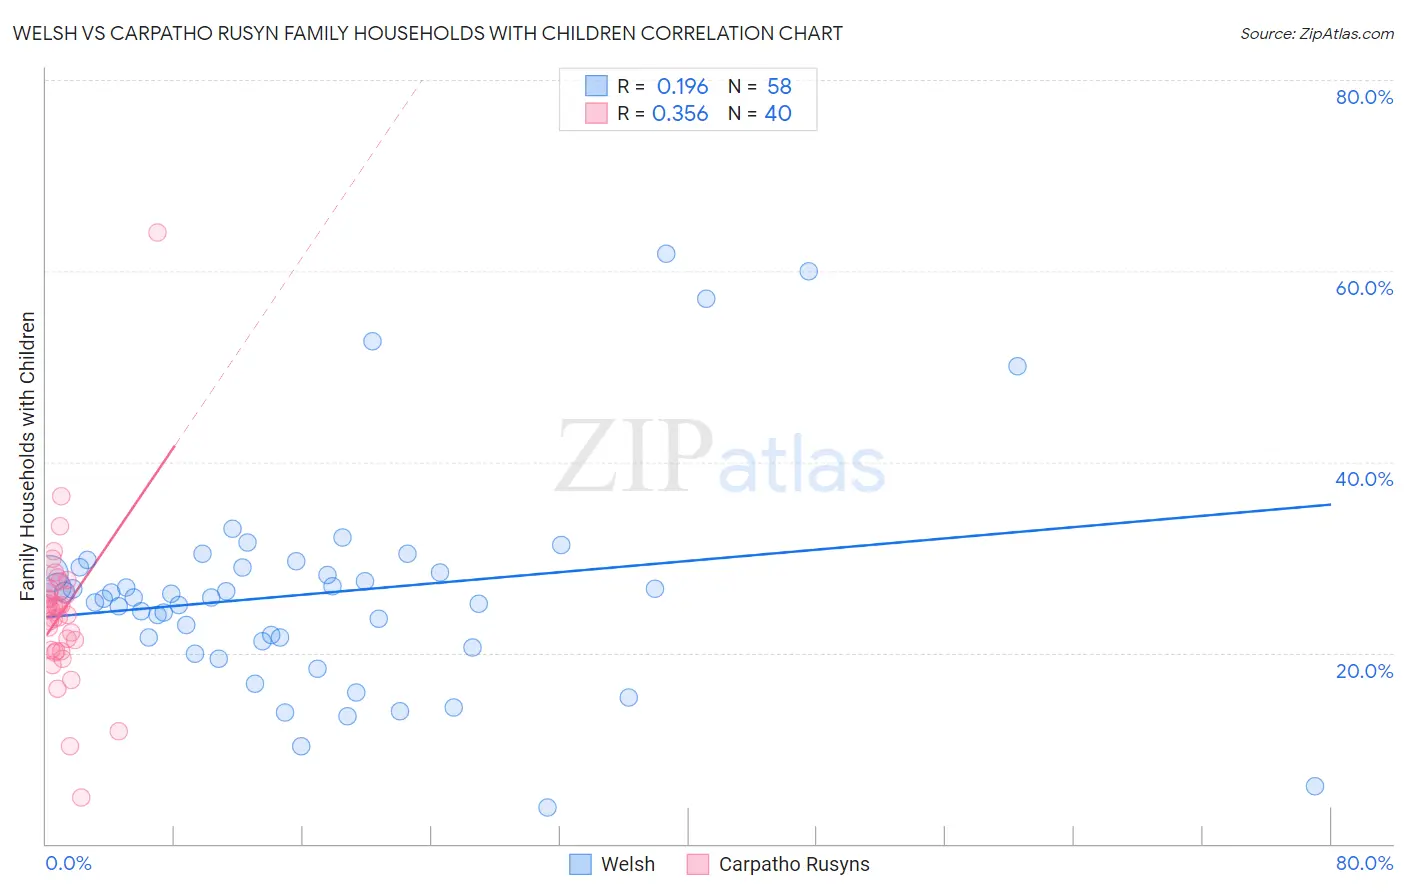
Welsh vs Carpatho Rusyn Family Households with Children Correlation Chart
The statistical analysis conducted on geographies consisting of 527,895,960 people shows a poor positive correlation between the proportion of Welsh and percentage of family households with children in the United States with a correlation coefficient (R) of 0.196 and weighted average of 27.2%. Similarly, the statistical analysis conducted on geographies consisting of 58,871,401 people shows a mild positive correlation between the proportion of Carpatho Rusyns and percentage of family households with children in the United States with a correlation coefficient (R) of 0.356 and weighted average of 25.2%, a difference of 8.0%.
Family Households with Children Correlation Summary
| Measurement | Welsh | Carpatho Rusyn |
| Minimum | 3.8% | 4.8% |
| Maximum | 61.8% | 64.0% |
| Range | 58.0% | 59.2% |
| Mean | 26.3% | 24.3% |
| Median | 25.8% | 24.6% |
| Interquartile 25% (IQ1) | 21.2% | 20.2% |
| Interquartile 75% (IQ3) | 28.9% | 26.6% |
| Interquartile Range (IQR) | 7.7% | 6.3% |
| Standard Deviation (Sample) | 11.3% | 8.7% |
| Standard Deviation (Population) | 11.2% | 8.6% |
Similar Demographics by Family Households with Children
Demographics Similar to Welsh by Family Households with Children
In terms of family households with children, the demographic groups most similar to Welsh are Immigrants from Ukraine (27.2%, a difference of 0.010%), Immigrants from Dominica (27.2%, a difference of 0.010%), Okinawan (27.2%, a difference of 0.020%), African (27.2%, a difference of 0.060%), and Northern European (27.2%, a difference of 0.060%).
| Demographics | Rating | Rank | Family Households with Children |
| Immigrants | Sudan | 21.6 /100 | #204 | Fair 27.3% |
| Immigrants | Haiti | 20.3 /100 | #205 | Fair 27.2% |
| Immigrants | Micronesia | 20.2 /100 | #206 | Fair 27.2% |
| Haitians | 19.8 /100 | #207 | Poor 27.2% |
| Immigrants | Poland | 16.4 /100 | #208 | Poor 27.2% |
| Dutch West Indians | 15.8 /100 | #209 | Poor 27.2% |
| Immigrants | Ukraine | 14.4 /100 | #210 | Poor 27.2% |
| Welsh | 14.2 /100 | #211 | Poor 27.2% |
| Immigrants | Dominica | 13.9 /100 | #212 | Poor 27.2% |
| Okinawans | 13.7 /100 | #213 | Poor 27.2% |
| Africans | 13.0 /100 | #214 | Poor 27.2% |
| Northern Europeans | 12.8 /100 | #215 | Poor 27.2% |
| Cubans | 12.2 /100 | #216 | Poor 27.1% |
| U.S. Virgin Islanders | 12.1 /100 | #217 | Poor 27.1% |
| Greeks | 11.4 /100 | #218 | Poor 27.1% |
Demographics Similar to Carpatho Rusyns by Family Households with Children
In terms of family households with children, the demographic groups most similar to Carpatho Rusyns are Immigrants from Grenada (25.2%, a difference of 0.0%), Pueblo (25.2%, a difference of 0.18%), Hopi (25.2%, a difference of 0.29%), Alsatian (25.3%, a difference of 0.44%), and Immigrants from Serbia (25.5%, a difference of 1.1%).
| Demographics | Rating | Rank | Family Households with Children |
| Immigrants | Switzerland | 0.0 /100 | #333 | Tragic 25.7% |
| Slovaks | 0.0 /100 | #334 | Tragic 25.7% |
| Immigrants | Croatia | 0.0 /100 | #335 | Tragic 25.7% |
| Immigrants | West Indies | 0.0 /100 | #336 | Tragic 25.7% |
| Puerto Ricans | 0.0 /100 | #337 | Tragic 25.6% |
| Arapaho | 0.0 /100 | #338 | Tragic 25.6% |
| Immigrants | St. Vincent and the Grenadines | 0.0 /100 | #339 | Tragic 25.6% |
| Immigrants | Armenia | 0.0 /100 | #340 | Tragic 25.6% |
| Immigrants | Serbia | 0.0 /100 | #341 | Tragic 25.5% |
| Alsatians | 0.0 /100 | #342 | Tragic 25.3% |
| Hopi | 0.0 /100 | #343 | Tragic 25.2% |
| Pueblo | 0.0 /100 | #344 | Tragic 25.2% |
| Immigrants | Grenada | 0.0 /100 | #345 | Tragic 25.2% |
| Carpatho Rusyns | 0.0 /100 | #346 | Tragic 25.2% |
| Soviet Union | 0.0 /100 | #347 | Tragic 24.8% |